Measuring the Quantum Yield with the Integrating Sphere Assembly for the FluoTime 300
Note: The integrating Sphere is made from Spectralon™. While this material provides excellent spectral reflectivity and spectral flatness it is also very sensitive to contamination. Due to the porous nature of its surface, it collects impurities easily. Any impurity will change the reflectivity of the inner walls of the integrating sphere and thus will influence the measurements. Therefore, handle the integrating sphere carefully avoiding any exposure to dust or other impurities. Avoid spilling sample into the sphere or contamination of the sample holder.
Step-by-Step
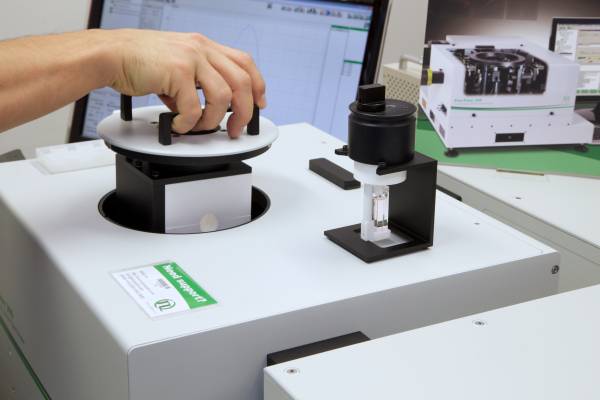
- Mount the integrating sphere carefully. Make sure you do not hit any optical elements inside the FluoTime 300. The integrating sphere assembly has an indexed lid to ensure proper orientation.
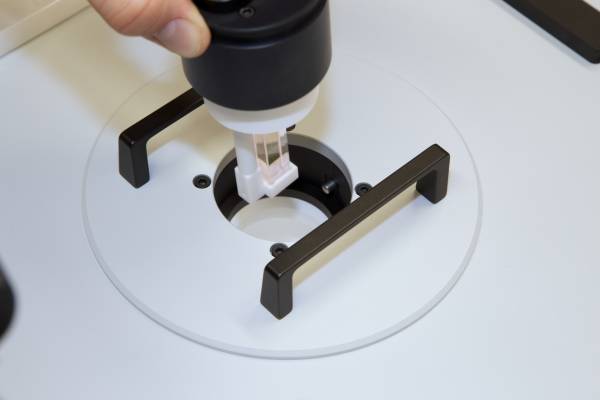
- Use the provided sample holder stand while inserting the sample into the sample holder.
- Put the sample holder into the IN-position.
- Put the sample holder into the integrating sphere
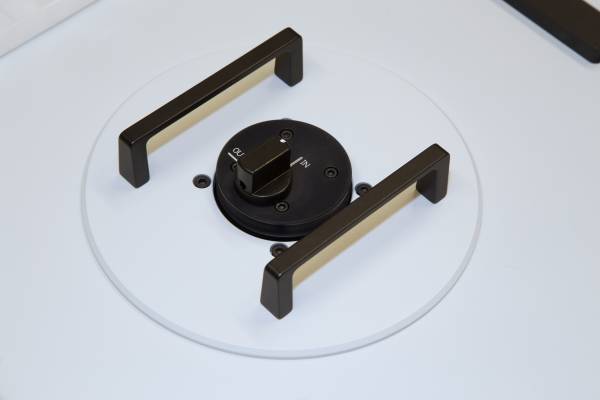
- Select either IN or OUT position
Note: The sample holder has two indexed positions. When in the IN position, the excitation beam will directly hit the sample, when in the OUT position the sample will only be illuminated indirectly (by diffuse light originating from the sphere's surface).
- Switch on FluoTime 300.
- Start the EasyTau Software.
- Open or create a workspace.
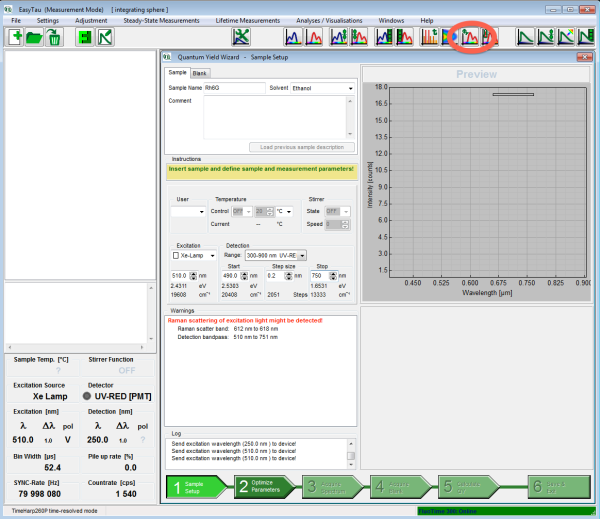
- Start the Quantum Yield Wizard.
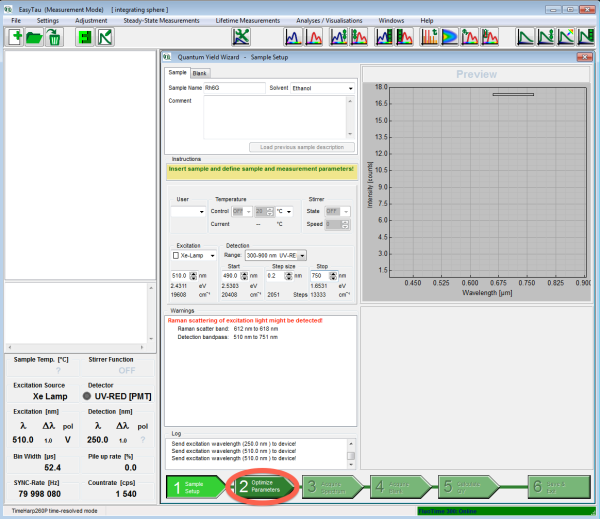
- On the first page of the Quantum Yield Wizard enter the sample name, solvent and measurement conditions. Make sure the starting wavelength is below the excitation wavelength.
Note: In this example with Rh6G as the sample we will use 510nm for excitation, therefore the spectral range will be from 500 nm to 700 nm.
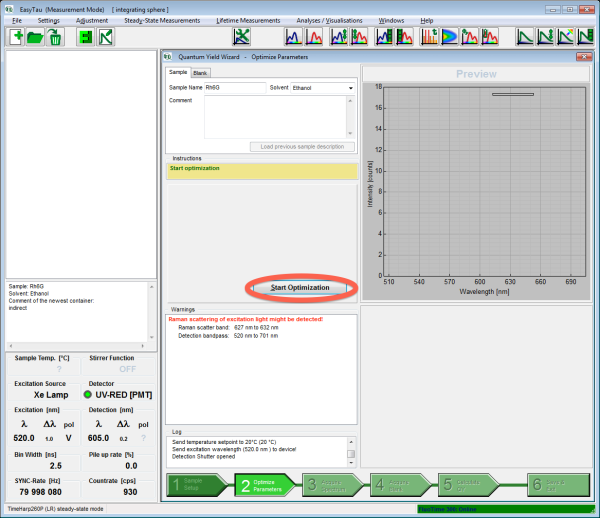
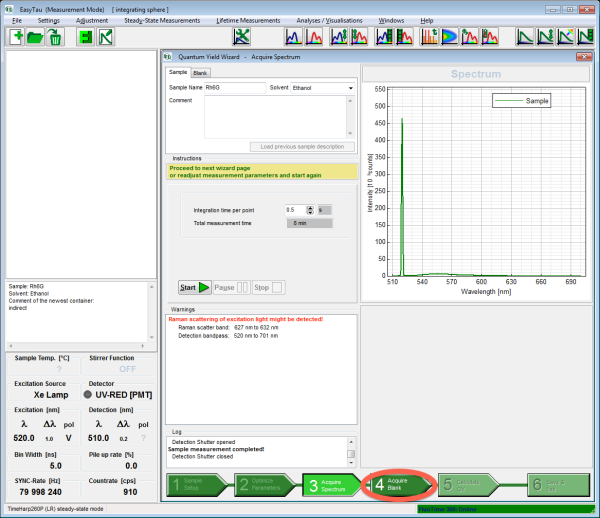
- Click the second step “Optimize Parameters” and start the optimization by clicking “Start Optimization”.
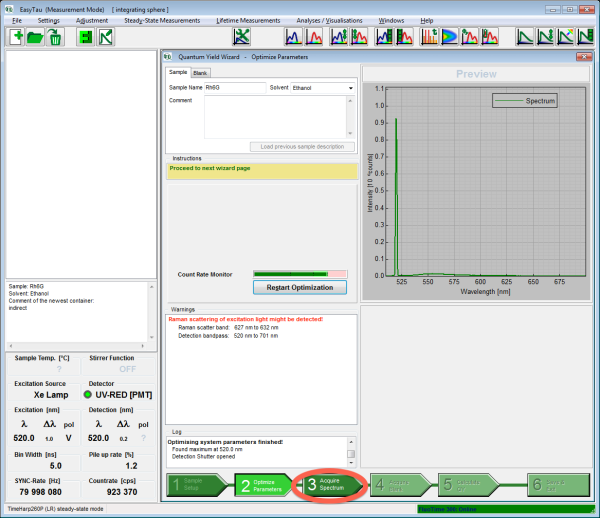
- After the optimization has successfully finished, click the “Acquire Spectrum” step and review the measurement conditions. If necessary tweak the acquisition time.
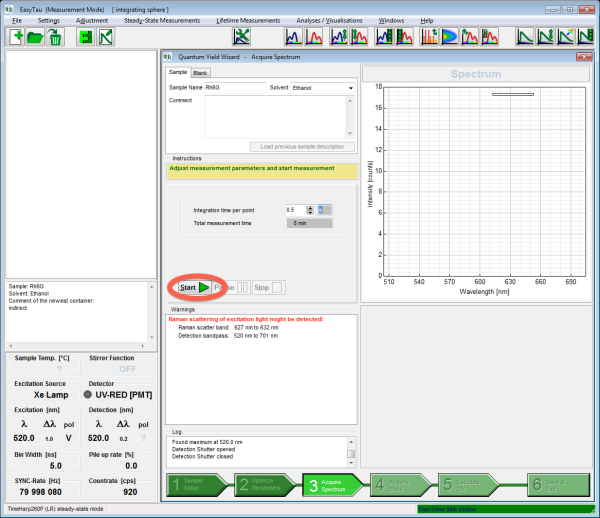
- Click the “Start” button and wait for the spectrum to be recorded.
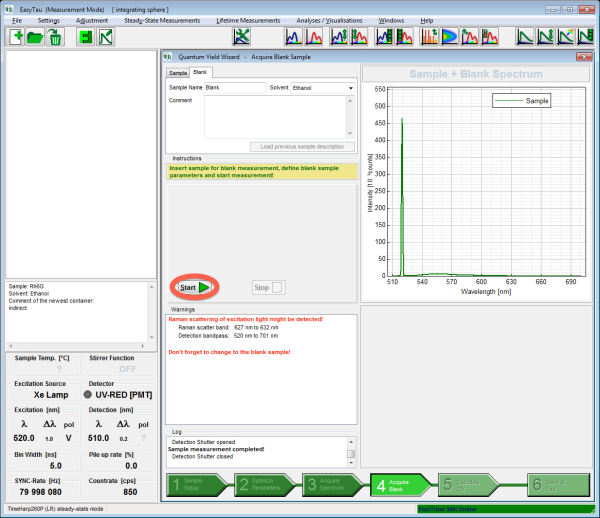
- When finished, click the “Acquire Blank” step.
- Before removing the sample holder make sure it is in the IN-Position.
- Insert the blank sample into the sample holder.
Note: The blank should have the same geometry as the sample. In our example this is a identical cuvette filled with the solvent (ethanol).
- Before inserting the sample holder into the integrating sphere put the sample holder into the IN-position.
- Select either IN or OUT position.
Note: The position should be the same as for the sample measurement.
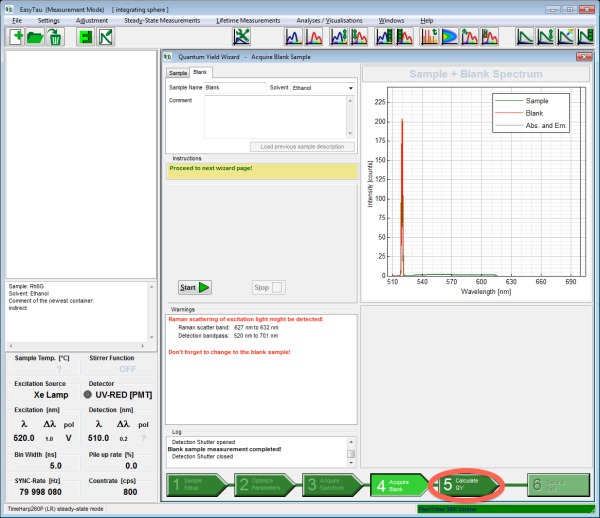
- Click the “Start” button.
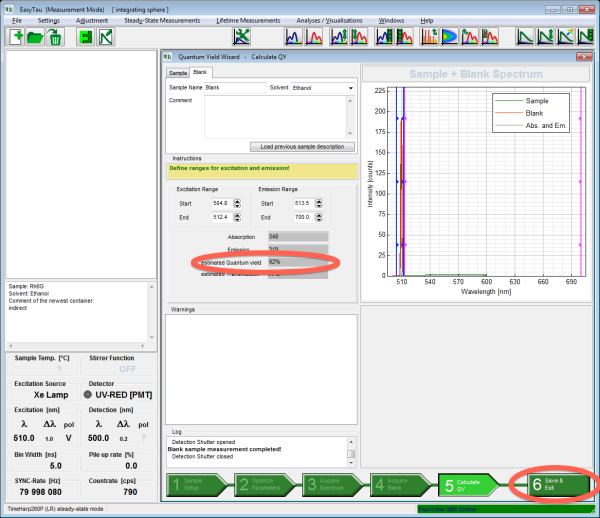
- After the acquisition of the blank spectrum has finished click the “Calculate QY” button.
- If necessary adjust the limits for excitation and emission.
Note: The values shown in the wizard may not be precise. The precise values are calculated when you reopen the saved QY measurement using the plot tool – see below.
- Click “Save & Exit” to store the measurement.
Note: The name of the data file will contain the approximate QY value.
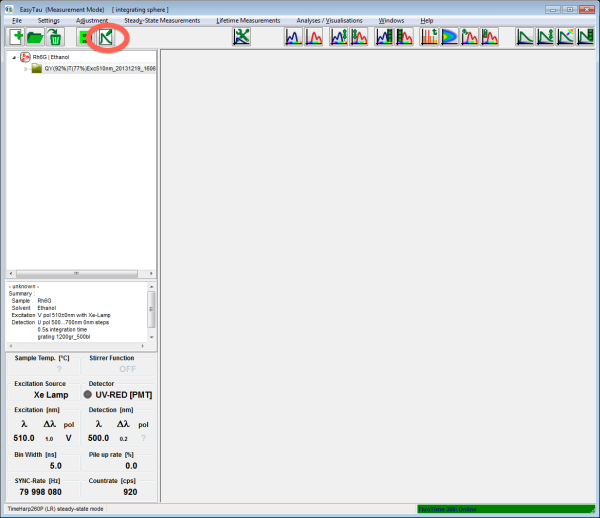
- Select the measurement and click the plot tool to open the QY measurement to get the precisely calculated QY.
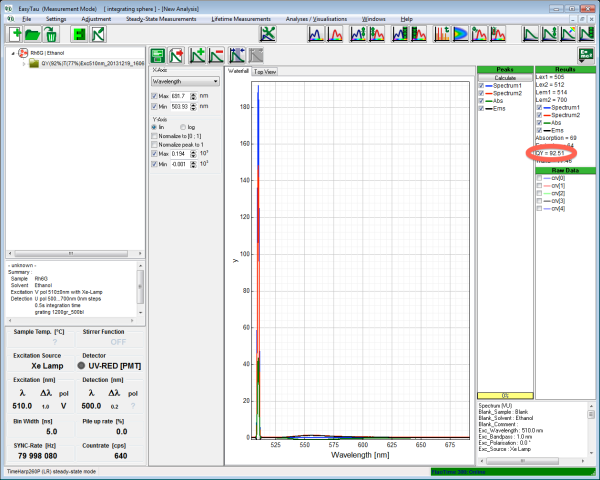
- The plot window will open, allowing you to examine the spectra in more detail and also giving you the possibility to (re)adjust the limits for the calculation. The QY is displayed in % in the results window.
