Introduction to Fluorescence Correlation Spectroscopy
General Background
Fluorescence Correlation Spectroscopy (FCS) is founded on the analysis of the fluctuations of the fluorescence intensity detected from a given system. FCS was introduced in the 1970's by Magde, Elson and Webb who developed the theory for analysing correlation curves obtained by measuring the fluctuations of the fluorescence intensity of a population of freely diffusing molecules. In short time, the theoritical framework of FCS was expanded to incorporate also the study of rotation diffusion. Unfortunately, at that time the application of FCS was impractical due to the limitations imposed by the available light sources, electronics and detectors. The technique started attracting more interest in the early 1990's when Widengren and Rigler used FCS to analyse the fluorescence fluctuations due to the transit of indvidual molecules through the detection volume of a confocal set-up.
Since then a series of studies have been performed applying FCS for the monitoring of various phenomena both in vitro and in living cells, including for example diffusion -coupled interactions like ligand binding, oligomerization or cleavage, photo-physical properties like the triplet-state kinetics or photo-isomerisation kinetics, protonation and FRET.
The autocorrelation function
In general all relevant information is conveyed by the normalised autocorrelation function, which is defined as the mean product of the fluorescence intensity F at time t with the fluuorescence intensity after a lag time τ divided by the mean fluorescence intensity squared:
$$ \begin{equation} G(\tau)=\frac{\langle F(t) \cdot F(t+\tau) \rangle}{\langle F \rangle^2}=1+\frac{\langle \delta F(t) \cdot \delta F(t+\tau) \rangle}{\langle F \rangle^2} \end{equation}, $$ where $ \begin{equation} \delta F(t) = F(t) - \langle F \rangle \end{equation}. $
Translational Diffusion - Confocal Volume
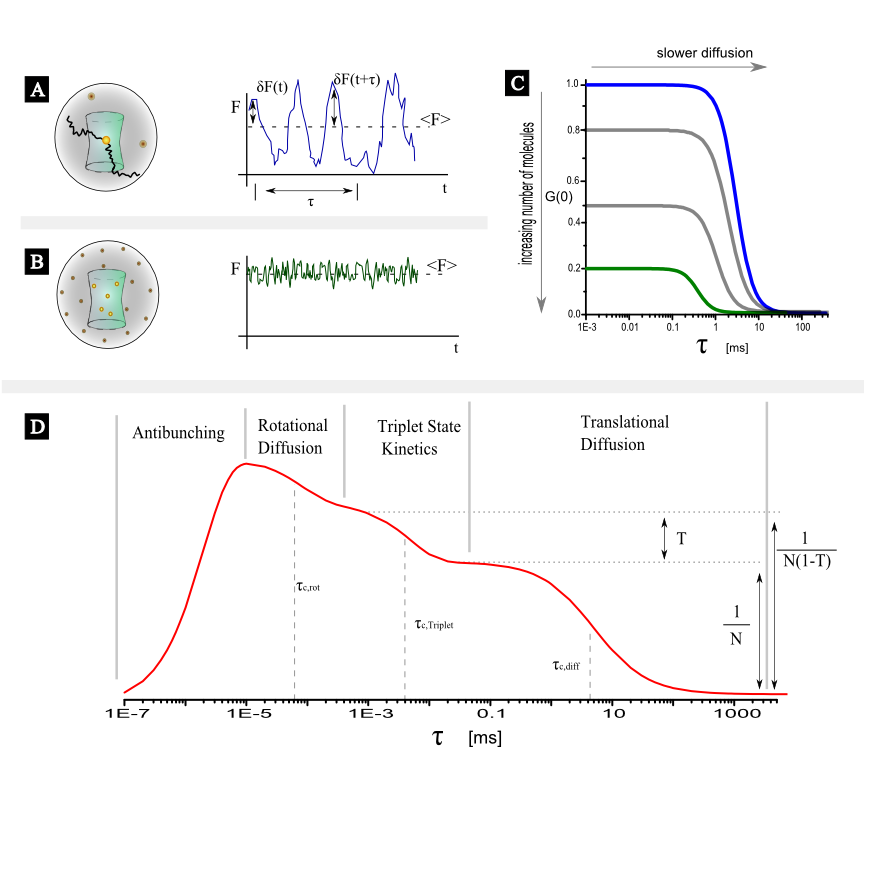
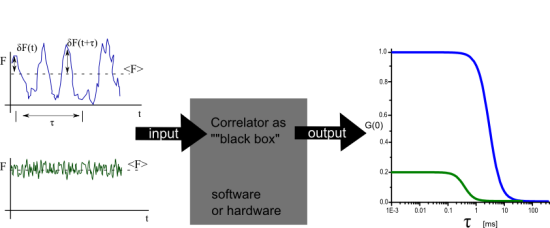
In this short article only the case of point, single color FCS with a confocal set up will be examined. For FCS of freely diffusing fluorescent molecules in a confocal setup the origin of the intensity fluctuations, will be the variation of the number of molecules inside the detection (assuming constant excitation settings). In figure 1A and figure 1B two different scenarios are illustrated. In figure 1A on average only 1 fluorescent molecule resides in the detection volume. As molecule diffuse in and out the relative fluctuations of the fluorescent intensity are large (no intensity when the molecule is out, high intensity when the molecule is in) in comparison with the average value. In figure 1B a few molecules reside in the detection volume on average, and thus the relative fluctuations will be smaller (always there are a few molecules in focus) in comparison to the average. This difference in the relative fluctuations is reflected in the correlation function. As it is seen in figure 1C the amplitude of the correlation function is different.
Assuming that the mean number of fluorescent molecules, $N$ within the observation volume follows a Poisson distribution and that the observation volume is described by a Gaussian ellipsoid, the autocorrelation function describing translational diffusion of fluorescent molecules through the detection volume will be given by:
$$
\begin{equation}
\label{eq2}
G(\tau) =\frac{1}{N} (1+\frac{\tau}{\tau_{diff}})^{-1} (1+\frac{\tau}{k^2\tau_{diff}})^{-\frac{1}{2}}+1=G_{Diff}(\tau)+1
\end{equation},
$$
where $\tau_{Diff}$ is the characteristic correlation time due to translational diffusion
and $k$ the ellipticity of the detection volume. The effective detection volume as “seen” by FCS will be a Gaussian ellipsoid with characteristic radius $\omega$ along the short axis.
The effective detection volume as “seen” by FCS is related to the confocal volume:
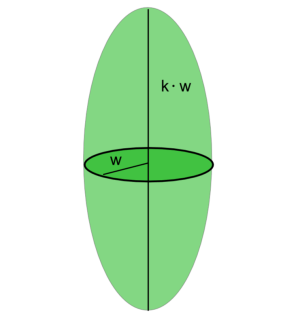
$$ \begin{equation} \label{eqVeff} V_{FCS}=\pi^{\frac{3}{2}}\omega^2\kappa\omega =2^{\frac{3}{2}}V_{confocal} \end{equation} $$ In equation $\ref{eq2}$ the diffusional correlation time is defined. The radius of the detection element as obtained by FCS will be related to the diffusion correlation time via the equation: $$ \begin{equation} \omega=2 sqrt(D\tau_{Diff}) \end{equation}. $$ $D$ is the translational diffusion coefficient, which for spherical particles follows the Stokes -Einstein relation: $$ \begin{equation} \label{eqEinsteinStokes} D=\frac{k_B T}{6 \pi \eta R_H} \end{equation}, $$ where $k_B$ is the Boltzmann coefficient, $T$ is the temperature, $\eta$ is the viscosity of the solvent (by itself depending on temperature), and $R_H$ is the hydrodynamic radius of the diffusing species. Within the spherical particle approximation, it is valid that $$ \begin{equation} R_H\propto M^{\frac{1}{3}} \end{equation}, $$ where $M$ is the mass of the particle.
The above equation can give you an idea about how big differences in diffusional correlation times one should expect in FCS studies. Assume that we use the same set-up to measure the diffusion of three globular fluorescent proteins with masses, $m_1= M_0$, $m_2= 1.5 \cdot M_0$, $m_3= 8 \cdot M_0$, with FCS. Then we would expect to record the corresponding diffusional correlation times, $\tau_1= t_0$, $\tau_2=1.14 \cdot t_0$, $\tau_3= 2 \cdot t_0$.
By fitting the model function presented in equation $\ref{eq2}$ to the experimental autocorrelation curves obtained by correlating the fluorescence intensity as shown in figure 1 the diffusional correlational time can be obtained. If the diffusion coefficient $D$ of the molecular species is known then the geomentrical factors $w$ and $k$ can be obtained and the effective confocal volume can be determined ($\ref{eqVeff}$). After the calibration of the detection volume one can use the diffusional correlation time to determine the diffusion coefficient of an unknown species.
You can visit the following links for more info regarding:
The generalised form of equation $\ref{eq2}$ for $n$ diffusing species of molecular brightness $B_i$, concentration $C_i$ and diffusion properties described by $G_{Diff,i}$ for $i=1,2,...,n$ is:
$$ \begin{equation} \label{eq7} G(\tau)=\frac{1}{\left(\sum{B_i\cdot C_i}\right)^2}\sum{(B_i \cdot C_i)^2 \cdot G_{Diff,i}(\tau)+1} \end{equation} $$ $ $
Additional processes - Triplet state kinetics
As evident from figure 1 processes spanning a dynamic range from ~ps to ~s can be manifested in an FCS curves. On short time scales processes like antibunching and rotational diffusion (~ns) can be monitored whereas in ~µs range processes like singlet-triplet kinetics, photo-isomerization and protonation can be observed. It is noted here that depending on the diffusion coeffiecient of the moelcular species under study, the viscosity of the solvent and the size of the confocal volume translatinal diffusion appears in the range of a few tenths of µs to a few tenths of ms. In general, if additional processes independent of translational diffusion take place the correlation function of each species could be written as:
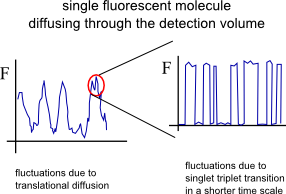
The most common process, in addition to translational diffusion, manifested in the auto-correlation function is the singlet-triplet kinetics. Triplet states are “dark” in terms of fluorescence and long-lived (up to ~ms). Imaginge that a fluorophore is excited a few thousands times, cycling between the first excited singlet state S1 and the ground state S0. With a certain probability there is the chance (typically 1 every few thousands S0-S1 transitions) that the fluorophore “jumps” to the triplet state (intersystem crossing) and becomes dark for some defined period of time. While in the triplet state the molecule could not be excited by the excitation laser (used for S0-S1 excitation) and cannot emit a fluorescence photon.
The model function including the singlet-triplet kinetics is given by the following equation: $$ \begin{equation} G(\tau)=\frac{1-T+T \cdot exp(-\frac{\tau}{\tau_{Diff}})}{1-T} \cdot G_{Diff}(\tau)+1 \end{equation}, $$ where $T$ is the average fraction of fluorescent species which reside in the triplet state or alternative the fraction of time a single molecule resides in the triplet state and $\tau_T$ is the characteristic triplet correlation time.
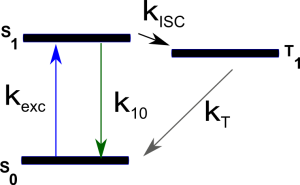
Both $T$ and $\tau_T$ depend on all the kinetic rates involved in the process: $$ \begin{equation} T=\frac{k_{exc}k_{ISC}}{k_{exc}(k_{ISC}+k_T)+k_{10}k_T} \end{equation} $$ $$ \begin{equation} \tau_T=(k_T+\frac{k_{exc}k_{ISC}}{k_{exc}+k_{10}})^{-1} \end{equation} $$ The kinetic scheme is depicted in the simplified Jablonsky diagram shown below:
where $k_{exc}$ is the excitation rate from S0 to S1, $k_{10}$ the overall relaxation rate from S1 to S0 (radiative and non-radiative relaxation), $k_{ISC}$ the intersystem crossing rate and $k_T$ the overall relaxation rate from T1 to S0.
Typical Assays based on single color FCS
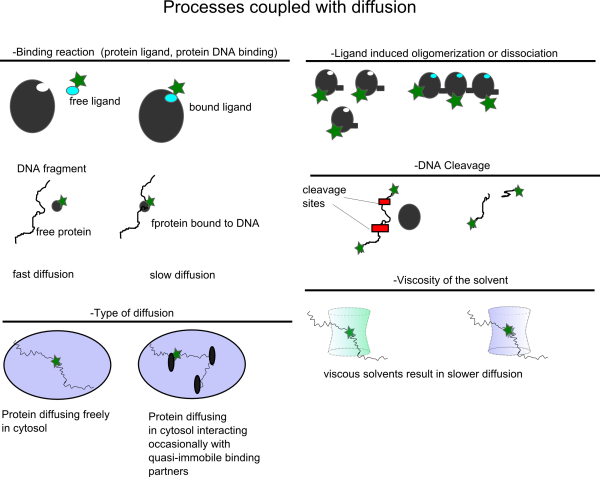
In the following figure some typical assays based on changes in the diffusional correlation time are shown.
There is another group of assays for which the presence of a specific molecular species, for example Oxygen or H+, influences the singlet-triplet kinetics or in general the photophysics of the fluorophore used. By analysing the FCS with the proper model function the Oxygen concentration or the protonation kinetic rates can be determined.
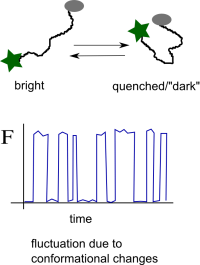
A third group of assays consists of the following general principle: a fluorophore and a quencher are covalently attached to the same biomolecule of interest. Either in the presence of an external stimulus (presence of specific ligand, temperature changes etc.) or because of the internal flexibility of the conformation of the biomolecule the quencher comes closer to the fluorophore and then the fluorophore becomes “dark”. By monitoring the fluctuations of the fluorescence one can infer the timescale of the conformational changes of the molecule under study.
A bit more on the correlation function
Correlation analysis is a statistical method for analysing all sorts of fluctuations from stock market changes to fluorescence signals. In general, it describes the self-similarity of the signal and by doing so it reveals any non-random trends present in it. In terms of fluorescence signals assuming that we get total fluorescence intensity $F_0$ at time $t_0$, the correlation function describes the probability of having the same level of the signal after lag time, $t=t_o+\tau$. The main difference of FCS with other type of autocorrelation analysis is that the curve is normalised to the average signal and that is why one can get correlation amplitude values larger than 1.
Nowadays hardware and software correlators are available which take the fluorescence signal as input and give the correlation curve as an output.
Practical Aspects
Concentration range
In practice for a confocal detection volume the usable concentration range is limited to ~pM to ~ 100s of nM. At higher concentrations the correlation curve will become flat.Let us consinder the case we have only translational diffusion of the emitters without any additional processes going on. In such a case the amplitude of the curve at τ=0 is equal to the inverse of the average number of emitters in the detection volume (check equation 2).Thus if in one solution one has N=1000 in the detection volume the amplitude G(0)= 0.001. If the number of molecules is increased the amplitude of the curve becomes even smaller. There will be a number of molecules that the fluctuations due to molecules going in and out of the volume will be smaller than the noise inherent to the fluorescence emission and at this point the correlation curve will become flat.
Objective Types
An excellent reference for the subject is given in Successful FCS Experiment in Nonstandard Conditions, Langmuir. 2014 by Banachowicz et al. In short here we can say that water and silicon objectives wit a correction collar can be used for acquiring FCS of good shape (corresponding to a Gaussain detection volume) up to 200 μm inside the solution. For the oil objectives which have no correction colar, due to the refractive index mismatch the detection volume gets distorted even at 5-10 μm inside the sample. While measuring with oil objective one observes a very strong dependence of the shape of the FCS curve depending on how far in the sample the detection volume is. One can get FCS curve with high quality air objectives. The NA or air objectives is less than 1, resulting in an elongated volume in z direction. As a consequence, in this case one has to use a model function for a 2D translational diffusion for fitting the measured correlation function.
Working distance and refractive index mismatch
Another practical issue is the working distance of the objective in combination with the refractive index mismatch between the immersion medium and the solvent/medium in which the FCS measurement are performed. Simply put, one has to deal with the following question:
how far inside the sample can one position the focal volume and still get a reasonable FCS curve?
Water immersion objectives (for example Olympus UPLSAPO 60x/1.2w) have a large working distance, typically longer than 200 µm . On the other hand, oil immersion objectives (for example Olympus UPLSAPO 100x/oil) have working distances of about 100 µm.
The general trend one has to consinder is:
the deeper into the measurement medium one positions the detection volume the more distorted the volume gets.
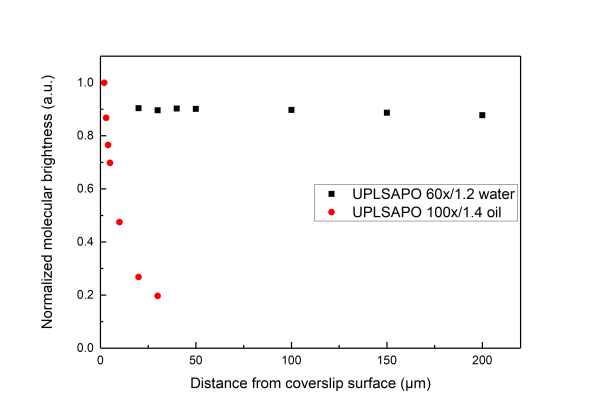
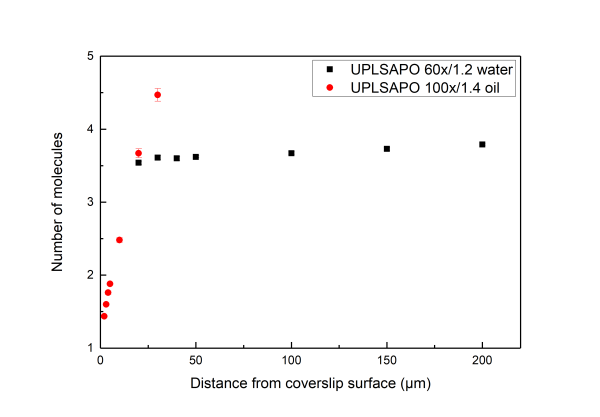
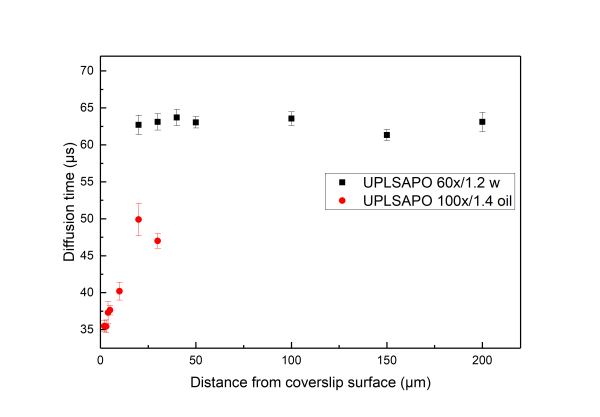
A distorted detection volume results in poor fitting of the measured FCS curve, lower molecular brightness, higher apparent number of molecules and longer diffusion times.
This effect is intensified when there is big refractive index mismatch between the immersion medium of the objective and the measurement medium and also if the medium exhibits stong refractive index variabilities.
One should not measure FCS exactly at the coverslip surface as electrostatic interaction between the coverslip and the dye can influence the observed fluctutions and also since then parts of the detection volume will not be inside the solution.
All in all we suggest that in aqueous environments FCS measurement with water objectives are performed at least 20 μm iniside the solution whereas for the case of oil objectives no more than 5 µm inside the solution.
Below we present measurements performed both with a water and an oil objective in a water droplet containing ATTO 655 (640nm pulsed excitation at 20MHz). All experimental parameters are kept the same except the distance inside the droplet at which the focal volume was positioned. It can be readily seen that although for the water objective the parameters are independent of the positioning of the volume inside the droplet drastic effects are observed for the case of the oil objectives.
Detection Volume Size - Saturation effects
Saturation effects are well described in the literature (see section Further Reading, Gregor et al 2005).In practice saturation manifests itself as deviation from a linear relationship between the Molecular Brghtness and the excitation power. At low power increasing the excitation leads to higher Molecular Brightness but at high excitation power a plateau is reached as shown in the following graph (
the measurements are done on aqueous solution of Atto 655 )
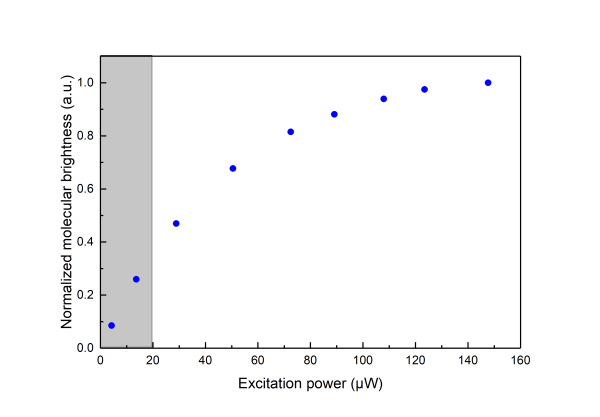
\\Saturation effects have to be considered when one would like to use FCS for measuring the dimensions of the confocal volume as saturation leads to an apparent broadening of the confocal volume as seen by FCS.
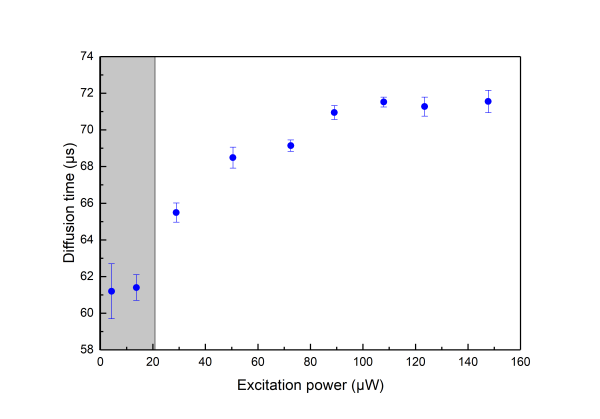
Saturation is always present thus one when using FCS for determining the detection volume should try minimising its effects by measuring at very low excitation power. In practice, neverthelees one should also like to get good signal-to-noise ratio so that acquisition times do not become very long.As a good practical trade off we suggest for the determination of the detection volume excitation powers corresponding to less than 30% of the maximum Molecular Birghtness to be used (coresponding to the shaded area in the above graphs).
Training Measurements
If you are starting with FCS a good idea is to initially take some simple measurements that will allow you to familiarize with the technique. Take a solution of a dye included in this list of standard dyes for FCS and perform a series of measurements which will increase your idea about many practical aspects of FCS.
- Make a series of measurements with increasing excitation power. You can plot how the molecular brightness, the diffusion time and the triplet fraction (in case the fluorophore has a triplet state) depend on the excitation power. At high powers you can see that an increase of the excitation power is not accompanied with an increase of the molecular brightness. This is due to saturation.
Below you see a typical behavior of the obtained molecular brightness and diffusion times depending on the excitation power. - As a complementary practice change the pinhole size for a given excitation power. Plot again how the molecular brightness, the diffucion time and the triplet fraction are influenced by the pinhole size.
- If you are using a water objective try to repeat the same FCS measurements with various correction collar settings. Wrong correction collar settings can have a detrimental effect in the measured FCS curve.
- If you have an oil immersion objective try to acquire FCS curve for various depth positions inside the sample.
Cross-Correlation standards
-to be added soon
Fitting Results - Reproducibility
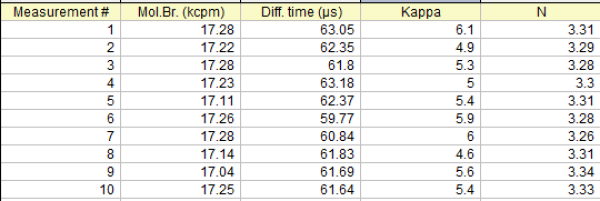
FCS results are very reproducible. We present here a table of the fitting results of 10 successive measurements on the same droplet of ATTO 655 in water.
From the above results the mean values and the standard deviation can be calculated:
Molecular Birghtness: 17.21 +/- 0.08 kcpm
Diffusion Time: 61.85 +/- 1.00 µs
Kappa factor: 5.42 +/- 0.49
Number of molecules, N: 3.30 +/- 0.02
Keep in mind that very long measurements on the same droplet may be hindered by evaporation of the solvent making the apparent number of molecules to be increasing as time goes by. Large day-to-day or week-to-week variations in the FCS results are most likely caused by experimental factors like misaligned set-up, differences in excitation power, uncalibrated pipettes, uncontrolled adsorption of the emitters on the coverslip surface, differences in lab temperature.
Further Reading
Note: The references given here serve as examples. There are many more excellent FCS-related articles that could guide you through the use of FCS.
General Introduction to the theory, the technique and its limitations:
- Elson, 2011, “Fluorescence Correlation Spectroscopy:Past,Present, Future”
- Krichevsky and Bonnet, 2002, “Fluorescence Correlation Spectroscopy: the technique”
- Enderlein et al, 2004, “Art and Artefacts of Fluorescence Correlation Spectroscopy”
- Wohland et al, 2001, “The standard deviation in fluorescence correlation spectroscopy”
- Widengren et al, 1995, “FCS of triplet states in solution:A theoretical and experimental study”
- Gregor et al, 2005, “Optical Saturation in FCS under continuous wave and pulsed excitation”
- Koppel, D. 1974, “Statistical accuracy in fluorescence correlation spectroscopy”
- Petra Schwille, Elke Haustein: “FCS: An Introduction to its Concepts and Applications”
In depth presentation of the field:
- Volume I and II of “Methods in Enzymology” dedicated to Fluorescence Fluctuation Spectroscopy (FFS), Part A and B: 518.
Advanced FCS techniques
Until now several different realizations of the FCS principles have been introduced (listing probably not complete):
- Two-color fluorescence cross-correlation spectroscopy, FCCS
Weidemann et al., 2002, “Analysis of ligand binding by 2 color cross-correlaiton spectroscopy”
Stromqvist et al., 2011, “A modified FCCS procedure applied to Ly49A-MHC Class I cis interaction studies in cell membranes” - Lifetime-filtered FCS
Ishii et al., 2015, “Lifetime-Weighted FCS and 2D FLCS:Advanced Application of Time-Tagged TCSPC”
Gregor and Enderlein,2007 “Time Resolved methods in biophysics. 3. Fluorescence Lifetime Correlation Spectroscopy”
Bohmer et al., 2002, “Time-resolved fluorescence correlation spectroscopy” - Pulsed Interleaved Excitation FCCS, PIE-FCCS
Lamb et al, 2005,, Enhancing the sensitivity of fluorescence correlation spectroscopy by using time-correlated single photon counting.
Triffo et al, 2012, “Monitoring Lipid Anchor Organization in Cell Membranes by PIE-FCCS” - FCS in live cells
König et al., 2015, “Single-molecule spectroscopy of protein confomational dynamics in live eukaryotic cells”
Hink, 2014, “Quantifying intracellular dynamics using fluorescence fluctuation spectroscopy”
Kaur et al., 2013, “Probing transcription factor diffusion dynamics in the living mammalian embryo with photoactivatable fluorescence correlation spectroscopy”
Wachsmuth et al, 2015, “High-throughput fluorescence correlation spectroscopy enables analysis of proteome dynamics in living cells” - two-photon FCS
Schwille and Heinze, 2001, “Two-Photon cross-correlation spectroscopy” - scanning FCS
Ries and Schwille, 2006, “Studying slow membrane dynamics with comtinuous wave scanning FCS” - Total Internal Reflection, TIRF-FCS
Leutenegger et al., 2006, “ Dual-color total internal reflection fluorescence cross-correlation spectroscopy” - Stimulated Emission Depletion;STED-FCS
Clausen et al., 2015, “A straightforward approach for gated STED-FCS to investigate lipid membrane dynamics”
Mueller et al., 2011,“STED nanoscopy reveals molecular details of cholesterol and cytoskeleton modulated lipid interactions in living cells” - SPIM FCS
Wohland et al, 2010, “SPIM FCS probes inhomogeneous three-dimensional environments” - two-focus FCS
Dertinger et al., 2007, “Two-focus FCS: a new tool for accurate and absollute diffusion coefficient”
Kriegsmann et al., 2009, “Translational Diffusion and Interaction of a Photoreceptor and Its Cognate Transducer Observed in Giant Unilamellar Vesicles by Using Dual-Focus FCS”
Dertinger et al., 2008, “The optics and performance of dual-focus fluorescence correlation spectroscopy”
Goossens et al., 2015, “Accurate Diffusion Coefficients of Organosoluble Reference Dyes in Organic Media Measured by Dual-Focus Fluorescence Correlation Spectroscopy” - Inverse-FCS
Wennmalm and Widengren, 2010, “Inverse Fluorescence cross-correlation spectroscopy” - FCS in artificial nanodomains
Wenger and Rigneault, 2010, “Photonic methods to enhance FCS and single molecule fluorescence detection”. - Photo-thermal Correlation Spectroscopy
Paulo et al, 2009, “Photothermal Correlation Spectroscopy of Gold Nanoparticles in Solution” - FCS-FRET
Felekyan et al, 2013, “Analyzing Förster resonance energy transfer with fluctuation algorithms.”
Sahoo and Schwille 2011, “FRET and FCS – friends or foes?” - Image correlation methods (Image Correlation Spectroscopy, ICS; Spatio-temporal image correlation spectroscopy, STICS; Raster Image Correlation Spectroscopy, RICS)
Kolin and Wiseman, “Advances in image correlation spectroscopy: measuring number densities, aggregation states, and dynamics of fluorescently labeled macromolecules in cells.”
Digmann and Gratton, 2009, “Analysis of diffusion and binding in cells using the RICS approach.” - Reviews on modern/advanced FCS implementations
Dertinger and Rüttinger, 2015,“Advanced FCS: An Introduction to Fluorescence Lifetime Correlation Spectroscopy and Dual-Focus FCS”
