Static Anisotropy Analysis for Images
Summary
This tutorial shows step-by-step, how the Anisotropy script of SymPhoTime 64 is used to calculate a 2D image of the static anisotropy. The anisotropy script is applied to an image of single molecules to calculate the static anisotropy and a histogram with the anisotropy distribution.
Prerequisites
- This script performs a static anisotropy analysis on a time trace or an image. The analysis is based on the equations described in: 1).
- This script should be applied to an image which was recorded with linearly polarized excitation and two detectors. The fluorescence should have been splitted with a polarizing beamsplitter onto the two detectors. Consequently, one detector receives the fluorescence with a polarization parallel to the excitation light, the other with a polarization perpendicular to the polarization of the excitation light.
- The MicroTime200 or most LSM Upgrade Kits can be configured for anisotropy measurements, but require additional parts. In case of doubt, please contact PicoQuant to check which extra parts for your set-up are needed to measure polarization.
Step-by-Step Tutorial
Select a file and start the script
- Start SymPhoTime 64 software.
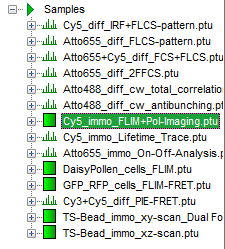
- Open the “Samples” workspace via “File\open Workspace” from the main menu.
Note: The “Samples” workspace is delivered with the SymPhoTime 64 and on the CD-ROM and contains example data to show the function of the SymPhoTime data analysis. If you haven't installed it on your computer, copy it from the DVD onto a local drive before going through this tutorial.
Response: The files of the sample workspace are displayed in the workspace panel on the left side of the main window.
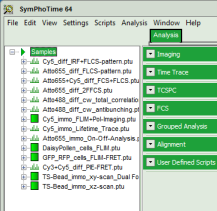
- Highlight the file
Cy5_immo_FLIM+Pol-imaging.
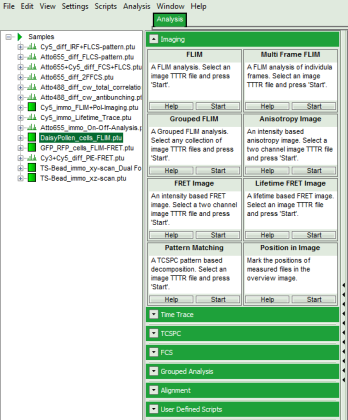
- Select the “Analysis” tab and in there, open the drop down menu “Imaging”.
Note: The drop down menu can be opened and closed by clicking on the grey button on the left side of the header of the drop down menu: 
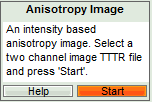
- Start the Anisotropy Image script by clicking on “Start”.
Response: The Anisotropy Image script is applied to the file Cy5_immo_FLIM+Pol-Imaging.ptu. Thereby, a new window opens which contains the anisotropy image and a histogram with the anisotropy distribution over the different pixels of the image.
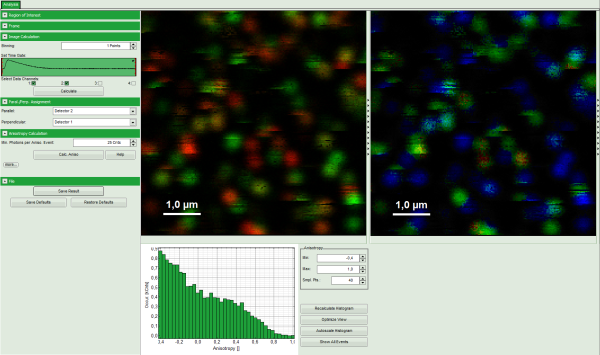
Note: The window contains four different regions:
- Left: Imaging analysis and processing options.
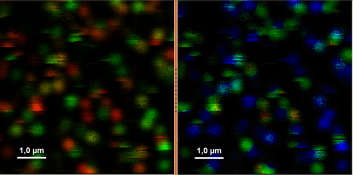
- Upper center: Fluorescence intensity image, displayed in false color scale. The perpendicular and parallel fluorescence intensities measured with the two detectors are displayed in green (perpendicular) and red (parallel).
- Upper right: Fluorescence anisotropy image. By default, the rainbow color scale is spread between -0.4 and 1.
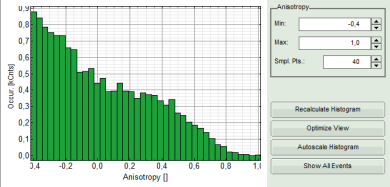
- Lower graph: Anisotropy histogram over the different pixels.
Note: The anisotropy values can theoretically spread between -0.5 and 1 for perpendicular and parallel excitation and emission dipoles respectively. The anisotropy value of 0 is expected in case of very fast rotation or extremely efficient energy transfer processes (e.g. efficient HOMO-FRET). When measuring a randomly aligned ensemble due to photoselection the anisotropy varies with in the limits of -0.2 and 0.4 instead of -0.5 and 1.
Adapt the script to the image and the system parameters
- Check in the parameter panel on the left:
- Is the assignment of detector 1 and detector 2 to parallel and perpendicular detection correct for your system? If not, invert the assignment.
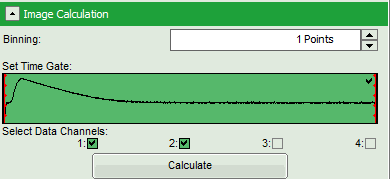
- Is the intensity of the image pixels large enough or should a pixel binning be perfomed? In that case increase the Binning from “1 Points” to a higher value and click “Calculate”.
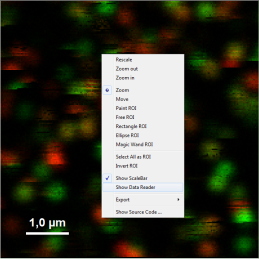
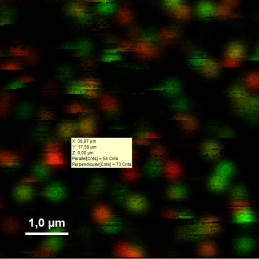
- Optional: You can check pixel intensities by placing the mouse over the intensity image, activate the context menu by a right mouse click and select “Show data reader”. The intensity of the pixel where the mouse is located is then shown in a small window.
⇓
- Optional: Should the anisotropy be calculated only for a region of interest (ROI)? In that case, place the mouse over the left image, activate the context menu with a right mouse click, select a ROI selection tool and mark the regions you want to analyze. Some more examples of how to use the ROI selection tools are described in the tutorial ROI fitting using the FLIM script, available from PicoQuant.
- Optional: If a higher threshold for the anisotropy calculation should be used, change the Min. Photons per Aniso. Event value, which is set to 25 by default.
Note: At the current setting, the anisotropy is only calculated, if the number of detected photons in one pixel is higher than 25. The calculation only becomes effective after clicking “Calc. Anisotropy”.
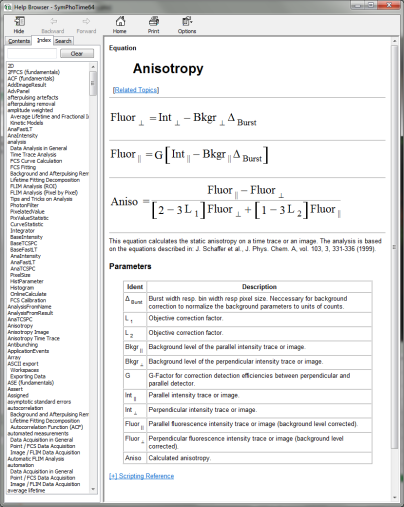
Clicking on the help button next to the “Calc. Aniso” button opens the help page, where the equation and calculation of the parameters are explained.
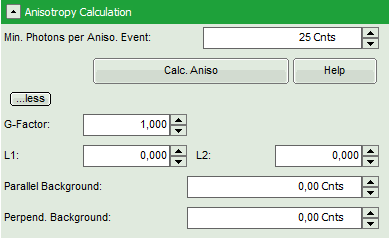
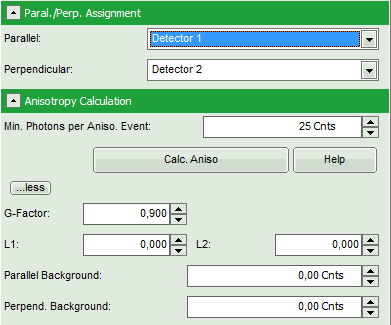
- To adapt the parameters describing your system, i.e. the G-factor and the correction factors L1 and L2, click on the “more” button. This opens a drop down menu to enter these parameters.
Note: The parameters vary for each system, but are usually constant under identical imaging conditions, i.e. excitation wavelength, filter configuration, objective and detectors. The correction factors L1 and L2 deviate from 0 especially when objectives with a high numerical aperture are used. The factors can be determined with a method described in: Kioshioka M et al., Appl. Spectr. 49, 224-228 (1995).
- After having performed all necessary adaptions, click “Calc. Aniso” to apply the changes to the image.
- Optional: If any intensity or color scale in the image should be adapted, click on the bar next to the image. This opens the display panel for the corresponding image to change the display settings.
⇓
- Optional: It is possible to adapt the display settings for the anisotropy frequency histogram in the corresponding controls.
- When the complete image is calculated and adapted, click “Save Result”.
Response: A result file (AnisotropyImage_1.pqres) is stored under the raw data file (Cy5_immo_FLIM_Po-Imaging.ptu).
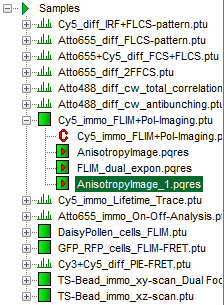
- Later, clicking on the result file reopens the file in the same way as it was stored.
Store permanently changes in the script
Note: Scripts can be adapted to perform always in the same way by saving it in a specific user profile. Whenever the user profile is loaded later on, the script is applied with the user specific changes. This is advantageous, if many images acquired under identical conditions (e.g. detector configuration and G-factor) should be analyzed.
- For illustration, apply the “Anisotropy Image” script to the file
Cy5_immo_FLIM+Pol-Imaging.ptuas described before. - Change the detector assignment, so that detector 1 is the parallel detector.
- Click on the “more…” button and “Aisotropy Calculation” to open the parameters for anisotropy calculations and change the G-factor to “0.9”. The result should look like this:
- Click on “File” → “Save Defaults”.
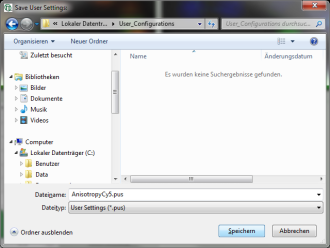
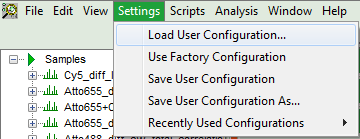
Response: The new values are stored internally, but the result is not yet permanent. To really save the new settings, select: “Settings\Save User Configuration as…”.
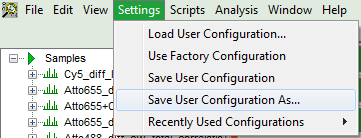
Response: A window opens aking where and under which name to save the User Configuration. Select e.g. the name anisotropy_Cy5.pus and store the new user profile.
Note: Usually, when a system is delivered, a folder “C:\User Configurations” is already present on the hard disc. If not, create it and save your profile there.
Response: The new user settings are saved under the given name as a file.
- To activate the user profile, go to “Settings\Load User Configuration”.
Response: A window opens to select the user settings file. Select the recently generated file.
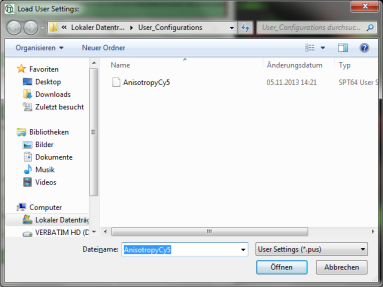
Response: A window pops up with the message that the software needs to be restarted to apply changes. Press OK.
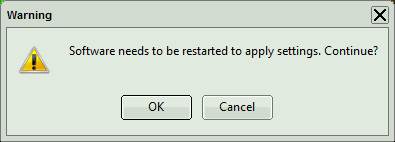
Response: Software restarts, but applies the user profile AnisotropyCy5.pus.
- If you apply now the “Anisotropy Imaging” script again on the file, the user defined G-factor and detector assignment are directly applied for the calculation.
