Separation of 2 Species with Different Lifetimes Using FLCS
Summary
This tutorial shows step-by-step, how the FLCS analysis can be used to calculate separate autocorrelation curves for the two components of a mixture of ATTO655 and Cy5 based on their different lifetimes.
Background Information
The two fluorophores ATTO655 (ATTO-Tec, Germany) and Cy5 (GE Healthcare) have almost identical spectral properties and are thus excited with the same wavelength (e.g. 635 nm) and detected at the same spectral range. As also their molecular weight is comparable, the diffusion constant is too similar to distinguish between both dyes in a mixture by means of standard FCS.
Nevertheless, the autocorrelation curves of both dyes differ in the microsecond range. ATTO655 shows practically no photophysical fluctuations. Therefore, FCS curves of ATTO655 can be fitted with the simplest 3D diffusion model, making it very suited for calibration. Cy5 on the contrary, exhibits a distinct bunching term on its FCS trace originating from photophysical processes, i.e. cis/trans isomerization.
The fluorescence lifetime of both dyes differ significantly (~1.8 ns for ATTO655 and ~1 ns for Cy5). In FLCS (Fluorescence Lifetime Correlation Spectroscopy), the lifetimes are used to create specific photon filters allowing to calculate FCS autocorrelation curves for each lifetime component. The aim of this script is to demonstrate, how two FCS traces are calculated from the same dataset, a nanomolar solution of a mixture of both components.
Since the dye separation is based on fluorescence lifetime measurements via TCSPC, this script can only be applied, if at least one fluorophore is excited with a pulsed laser.
Step-by-Step Tutorial
Select a file and start the script
- Start SymPhoTime 64 software.
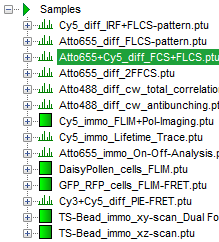
- Open the “Samples” workspace via “File\open Workspace” from the main menu.
Note:
The “Samples” workspace is delivered with the SymPhoTime 64 and on the DVD-ROM and contains example data to show the function of the SymPhoTime 64 data analysis. If you haven't installed it on your computer, copy it from the DVD onto a local drive before going through this tutorial.
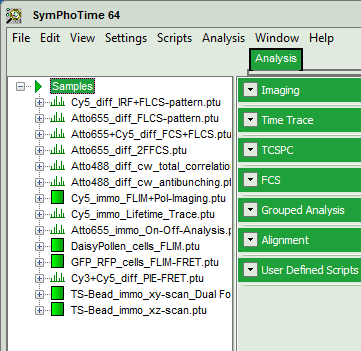
Response: The files of the sample workspace are displayed in the workspace panel on the left side of the main window.
- Highlight the file
ATTO655+Cy5_diff_FCS+FLCS.ptuby a single mouse click.
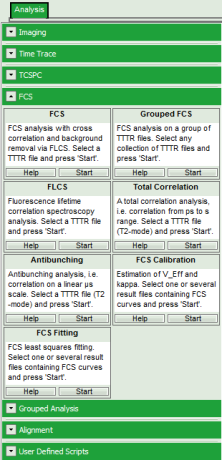
- Select the “Analysis” tab and in there, open the drop down menu “FCS”.
Note:
The drop down menu can be opened and closed by clicking on the grey button on the left side of the header of the drop down menu: 
- Start the FLCS script by clicking on “Start”.
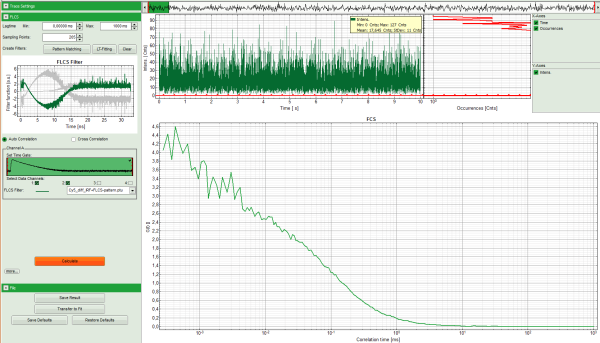
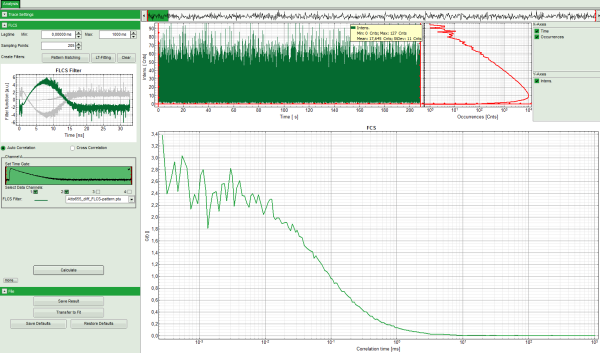
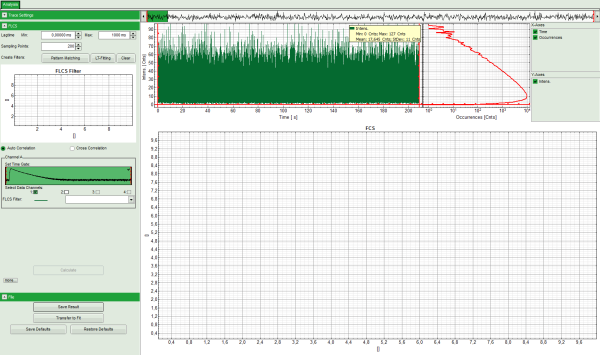
Response: The FLCS script is applied to the file ATTO655+Cy5_diff_FCS+FLCS.ptu. Thereby, a new Window opens:
Note:
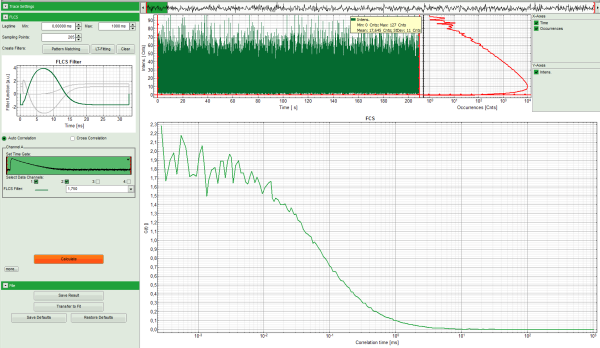
The window contains three different regions:
- Left: Analysis and display options. For explanation of the different parameters, place the mouse cursor over this part of the window and press <F1> to open the corresponding help page.
- Upper center/right: Intensity time trace. The display can be changed using the “trace display settings” of the analysis options. The large window shows the inset of the complete trace above highlighted in green. The photon counting histogram on the right displays the frequencies of the different intensity values. Usually, this trace is used to check, whether the signal is stable during the measurement. Also, large intensity spikes originating from aggregation of the fluorescent sample can be detected in this graph.
- Lower center/right: FCS trace window. As first the FCS correlation criteria have to be defined and the curve needs to be calculated, this graph does not contain any trace at this stage.
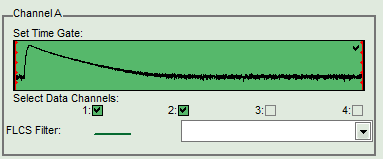
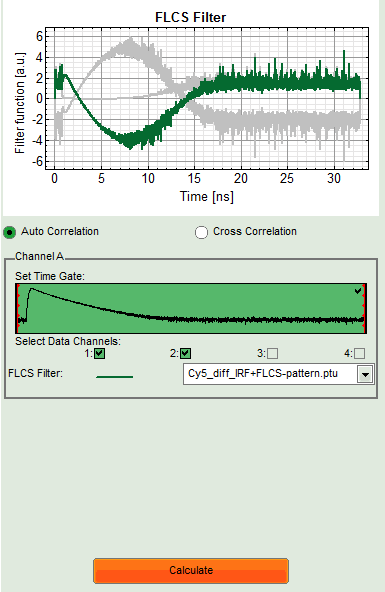
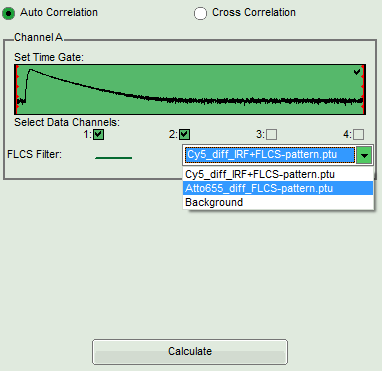
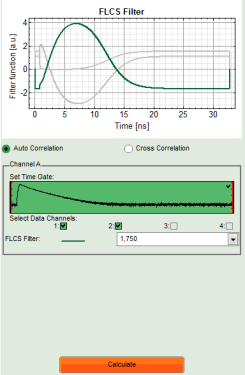
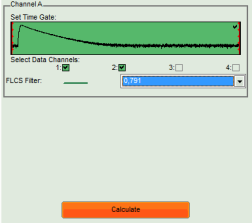
- In this file, the light was evenly splitted onto two detectors. Therefore, select both detectors in the definition of “Channel A”:
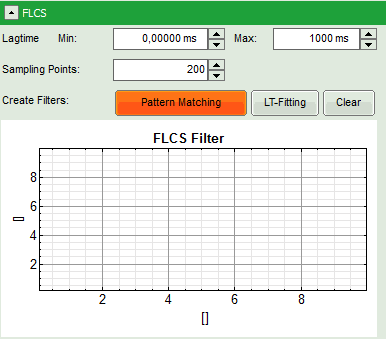
- Before calculating the FLCS trace, the FLCS filters for the individual components must be defined. The software offers two ways to define these filters:
- If the different dyes have been measured separately, and TCPSC curves of the two components are available, it is possible to load these TCSPC histograms as patterns for the filter definition. This is called “Pattern Matching” approach.
- If the individual TCSPC histograms are not available, or a dye is analyzed that changes its fluorescence lifetime under certain conditions, a lifetime fit can be performed of the TCPSC histogram of the measurement. The FLCS filters can be calculated from the fitted lifetime components. This approach called “LT (lifetime) fitting” can only be employed, if the two components that should be separated have a practically single exponential decay behavior.
Note:
As a prerequisite for both approaches the lifetime patterns of the two components must be sufficiently different. The next steps demonstrate both ways to define the FLCS filters. In practice, apply the better suited option according to the sample.
Definition of the FLCS Filters via Pattern matching (Option 1)
- In the “FLCS” drop down menu, click on “Create Filters\Pattern Matching”.
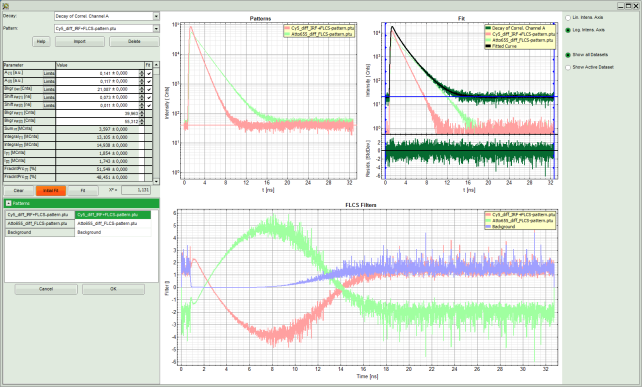
Response: The FLCS pattern matching windows pops up.
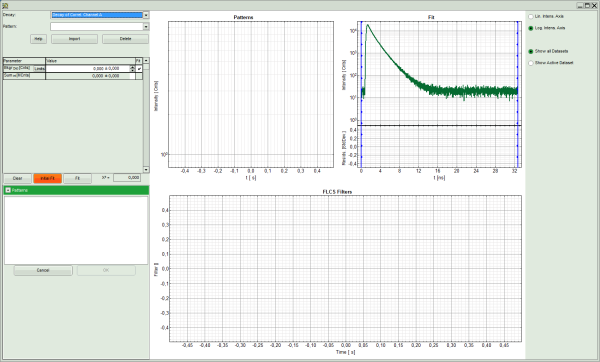
Note:
This window consists of different sections:
- Left: Controls for importing and fitting the patterns. Click on the “Help” button to learn about the meaning of the different parameters.
- Upper center: TCSPC histogram of the imported patterns. As we haven't loaded any pattern yet, this graph doesn't contain any data.
- Upper right: TCPSC curve of the measured data.
Lower center/right: FLCS filter curve. As no filter has been calculated yet, this graph is still empty.
- Click: “Import”.
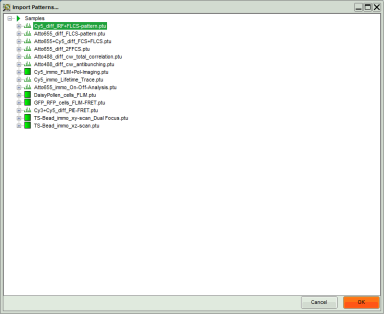
Response: Another window pops up containing the measurement files from the workspace.
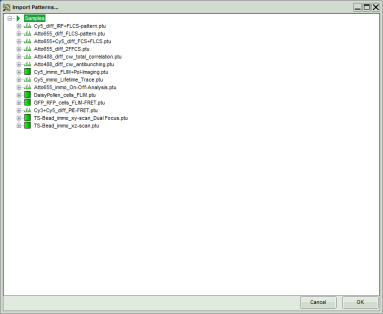
- Select the file
Cy5_diff_IRF+FLCS-pattern.ptuand click “OK”.
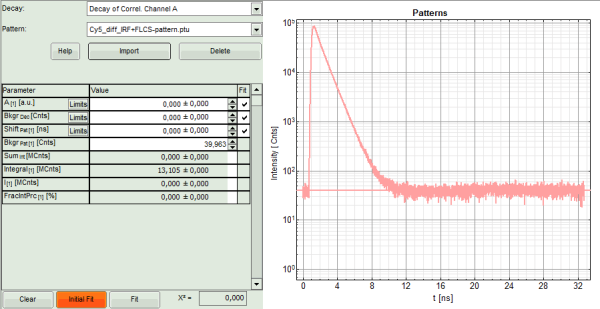
Response:
- The TCSPC histogram for this file appears in the “Patterns” graph in the upper center.
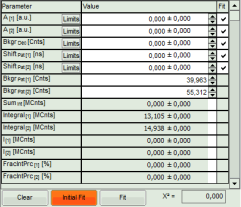
- A few parameters are added in the parameter display on the left.
- Click “Import” again to load the pattern for the second dye.
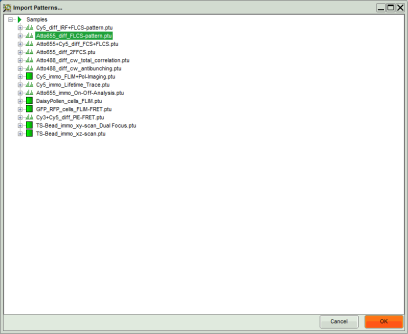
Response: A new window pops up containing the measurement files from the workspace.
- This time, select the file
ATTO655_diff_FLCS-pattern.ptuand press “OK”.
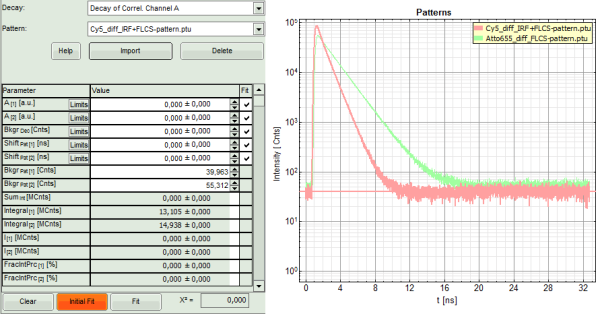
Response:
- The TCSPC histogram for this file is added to the “Patterns” graph in the upper center. This window contains now the TCSPC curves of both dyes.
- A few parameters are added in the parameter display on the left.
- Press “Initial FIT” to fit these patterns to the decay of the FCS measurement.
Response:
- The two patterns are fitted into the decay and appear in the graph on the upper right, as well as a fitting curve. The residuals of this graph are evenly spread around 0, indicating that the decay is well described as a sum of both patterns.
- Fitting values are added to the Fitting table. The χ² value close to 1 indicates that no further pattern is needed to fit the data.
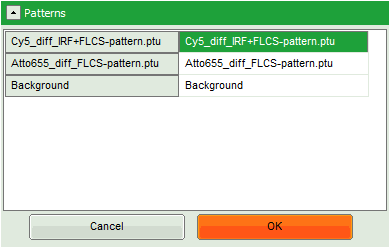
- Three FLCS filters are generated, which are named after the two files containing the loaded TCPSC patterns. The third pattern is the background. Note that for the pattern fit, the background in the TCSPC curves of the individual components is subtracted.
- As now the patterns are successfully calculated, click “OK”.
Response:
- The pattern definition window is closed.
- The FLCS filter functions are displayed in the graph on the left in the FLCS script main window. As the Cy5 pattern was loaded first, this pattern is active.
- Press “Calculate”.
Response:
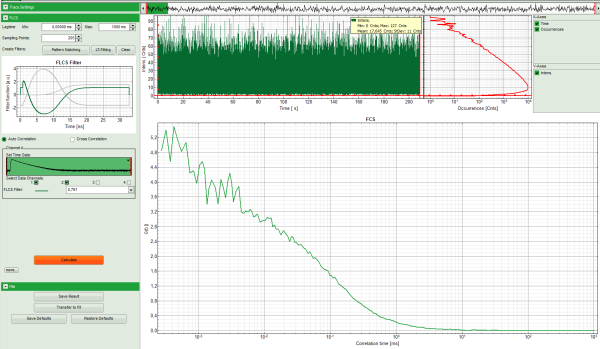
- The FLCS curve for this filter function is calculated. As the filter function is calculated from the Cy5 pattern, it practically contains the autocorrelation of only the Cy5 dye. The photophysical component (cis/trans isomerization) at short correlation times is clearly visible.
- Save this curve by clicking “SaveResult”.
Response:
- The result file is stored as
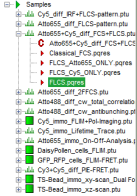
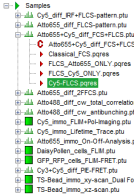
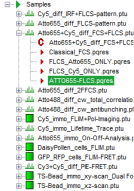
FLCS.pqres. In order to remember its contents, we rename it:Cy5-FLCS.pqres. Files can be renamed by clicking slowly twice onto the file name and typing in the new name.
⇓
- Now the FLCS autocorrelation curve for the second dye, ATTO655, must be calculated. Therefore, select this pattern in the FLCS main window and press “Calculate”.
Response:
- The FLCS curve for this filter function is calculated. As the filter function is calculated from the ATTO655 pattern, it practically contains the autocorrelation of only the ATTO655 dye. The photophysical component at short correlation times which was pronounced in the Cy5 correlation is now missing.
- Click on “Save result” to save this curve. Rename the generated file as
ATTO655-FLCS. - These curves can now be fitted by selecting “Transfer to fit”. The process of how to fit a FCS curve is explained in the tutorial Calculate and Fit FCS Traces with the FCS Script.
Definition of the FLCS Filters via Lifetime Fitting (Option 2)
- In the “FLCS” drop down menu, click on “Create Filters\LT-FItting”.
Response: The TCSPC fitting window pops up.
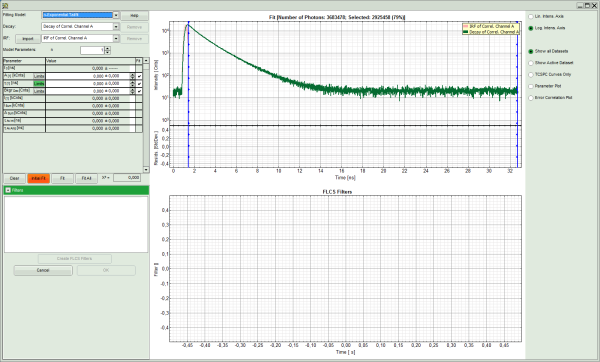
Note:
This window contains different sections:
- Left: Controls for fitting the TCSPC curve and the filters. Click on the “Help” button to learn about the meaning of the different parameters.
- Upper center/right: TCPSC curve of the measured data.
- Lower center/right: FLCS filter curve. As no filter has been calculated yet, this graph is still empty.
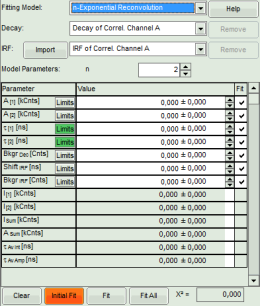
- To avoid wasting photons, select the “n-Exponenial Reconvolution” Fitting Model.
- As the sample contains two dyes, select 2 exponential components.
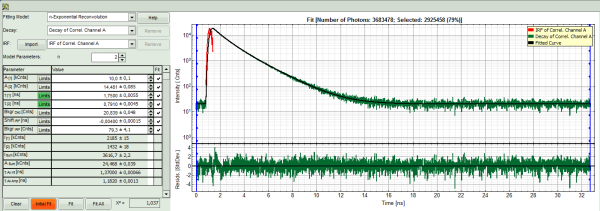
- Click “Initial Fit” (marked in orange).
Response: The TCSPC curve is fitted. A χ² close to 1 and nicely spread residual indicate a sufficiently good fit.
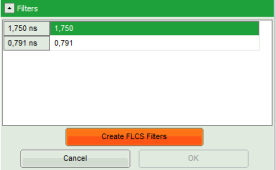
- Click “Create FLCS Filters”.
Response:
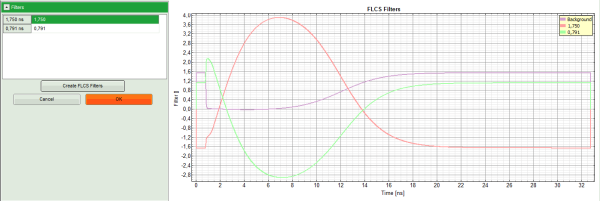
- Three FLCS filter curves are calculated and displayed in the lower graph. These filter curves correspond to the lifetime component of ~0.8 ns (Cy5), the lifetime component of ~1.8 ns (ATTO655) and the background, mainly caused by dark counts and detector afterpulsing.
- As now the patterns are successfully calculated, click “OK”.
Response:
- The pattern definition window is closed.
- The FLCS filter functions are displayed in the graph on the left in the FLCS script main window. As the ~1.8 ns component was assigned to lifetime 1, this pattern is active.
- Click “Initial Fit” (marked in orange).
Response:
- The FLCS curve for this filter function is calculated. As the filter function is calculated from the ~1.8 s (pattern of ATTO655), it practically contains the autocorrelation of only the ATTO655 dye. The curve only shows diffusion and no further bunching term as for Cy5.
- Save this curve by clicking “SaveResult”.
Response:
- The result file is stored as
FLCS.pqres. In order to remember its contents, rename it asATTO655-FLCS.pqres. Files can be renamed by clicking slowly twice onto the file name and typing in the new name.
⇓
- Now the FLCS autocorrelation curve for the second dye (Cy5) must be calculated. Therefore, select this pattern (corresponding to ~0.8 ns) in the FLCS main window and press “Calculate”.
Response:
- The FLCS curve for this filter function is calculated. As the filter function is calculated from the Cy5 pattern, it practically contains the autocorrelation of only the Cy5 dye. The photophysical component at short correlation times is now clearly visible.
- Click on “Save result” to save this curve. Rename the generated file as “Cy5-FLCS”.
- These curves can now be fitted by selecting “Transfer to fit”. The process of how to fit a FCS curve is explained in the tutorial Calculate and Fit FCS Traces with the FCS Script.
