Calculate Ratiometric FRET Images
Summary
This tutorial shows step-by-step, how the “FRET Image” script of SymPhoTime 64 can be used to calculate pixel-by-pixel the average FRET efficiency in an image containing several cells transfected with Cerulean/YFP constructs. To calculate the average FRET efficiency, a ratiometric approach based on the intensities in the donor and the acceptor channel is used.
Background Information
FRET is a method to determine molecular interactions or conformational changes based on a suited donor/acceptor pair.
Intensity FRET as used here can only be used to calculate average FRET efficiencies. In case of a mixed population, these populations can only be separated using a donor dye with a single exponential decay kinetic and analyzed with lifetime data. This is not the scope of this tutorial.
The script usage is demonstrated on an image of several cells which have been transfected with CENP-B-Cerulean and YFP-CENP-A. Cerulean is a CFP variant an frequently used as a FRET donor. The CENP-complex consists on several proteins and is involved in mitosis. For further details on the sample, see S. Orthaus et al., Chembiochem. 2008, 9, 77-92, and the PicoQuant application note http://www.picoquant.com/images/uploads/page/
files/7267/appnote_flim_fret.pdf.
The example image shows four cells, two of them were only transfected with CENP-B-Cerulean, the other two contain both constructs. The same image is also used for the tutorial of the lifetime FRET image script. Check there for comparison.
In ratiometric FRET, a lot of system parameters have to be determined from several images. This problem is too complex to be accessed with a single tutorial. In this tutorial, some arbitrary correction parameters are used for demonstration purposes only.
Several approaches have been published as procedures to calculate the needed correction parameters, e.g. 1); 2). Evaluating and reviewing all papers in this area would overpass the scope of this tutorial.
Step-by-Step Tutorial
- Start SymPhoTime 64 software.
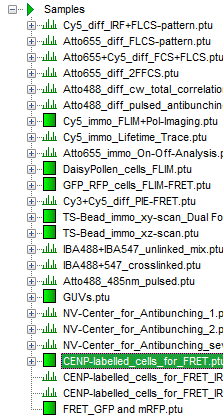
- Open the “Samples” workspace via “File\open Workspace” from the main menu.
Note: The “Samples” workspace is delivered with the SymPhoTime 64 and on the DVD-ROM and contains example data to show the function of the SymPhoTime 64 data analysis. If you haven't installed it on your computer, copy it from the DVD onto a local drive before going through this tutorial.
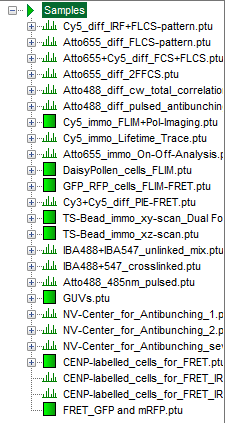
Response: The files of the sample workspace are displayed in the workspace panel on the left side of the main window.
- Highlight the file
CENP-labelled _cells_for_FRET.ptuby a single mouse click.
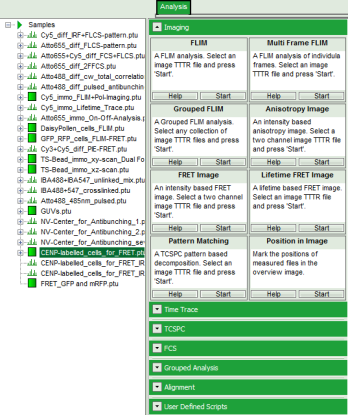
- Select the “Analysis” tab and in there, open the drop down menu “Imaging”.
Note: the drop down menu can be opened and closed by clicking on the grey button on the left side of the header of the drop down menu: 
- Start the “FRET Image” script by clicking on “Start”.
Response: The FRET image script is applied to the file CENP-labelled _cells_for_FRET.ptu.
Thereby, a new Window opens:
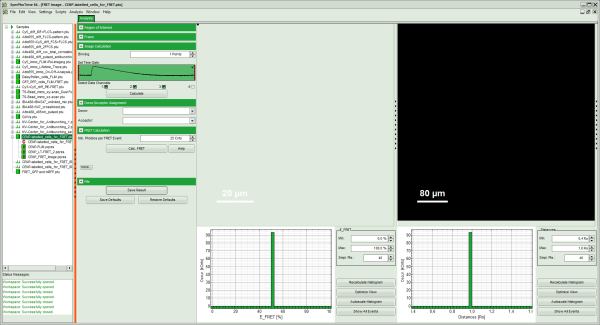
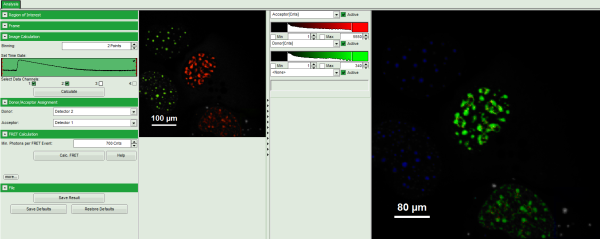
Note: The window contains five different regions:
- Upper left: imaging calculation analysis options.
- Upper center: Fast FLIM image, displayed in false color scale. As the donor and acceptor channels have not been assigned yet, this image area is still empty.
- Upper right: FRET image. As it has not been calculated yet, this area is still empty.
- Lower center: Here the FRET efficiency histogram over the selected pixels will be plotted when the calculation is performed.
- Lower right: Here the FRET distance histogram in terms of R0 will be plotted when the calculation is performed.
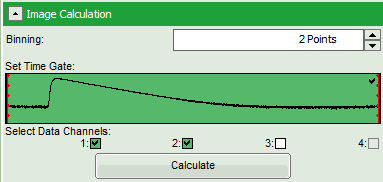
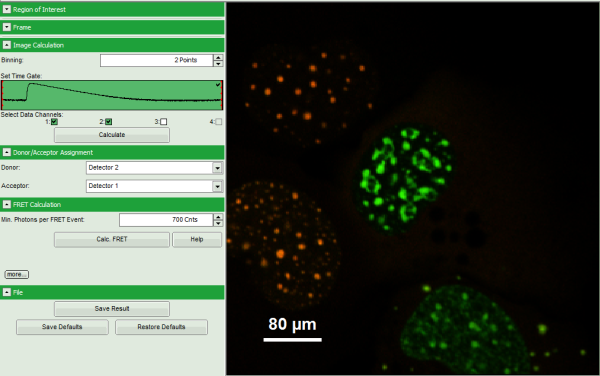
- Set the pixel “Binning” to 2 points.
- As data channels, check only Channel 1 and 2, as in these channels the relevant photons are recorded.
- Press “Calculate”.
Response:
- Automatically, the two active detector channels are assigned to the donor and acceptor channel. By default, detector channel 2 is considered the donor channel and detector channel 1 is assigned as acceptor channel.
Note: If this assignment is not correct, it can easily be inverted using the controls in the “Donor/Acceptor Assignment” panel.
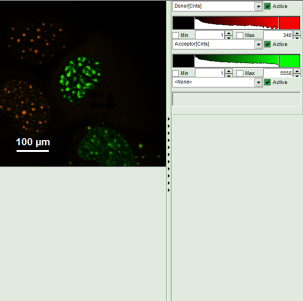
- A false color image is calculated, in which the intensity of detector 1 and 2 are plotted in green and red, respectively.
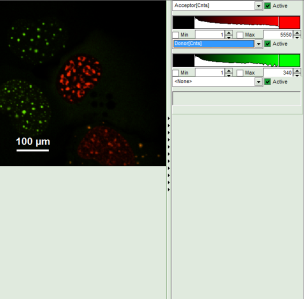
- Invert the color assignment to display the acceptor channel in red and the donor channel in green. Therefore, click on the bar next to the image to open the display options and invert the channel selection.
↓
Response: The image is adapted, the acceptor is now plotted in red.
Note: Now four cells are visible, the cells on the left are mainly plotted in green. These cells have only been transfected with the donor construct, while the other two cells are transfected with both constructs. The fluorescent spots are restricted to the nuclei, only some vesicles in the cytoplasm can be seen in the cell on the lower right.
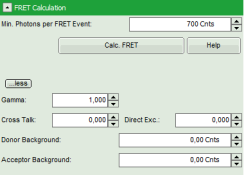
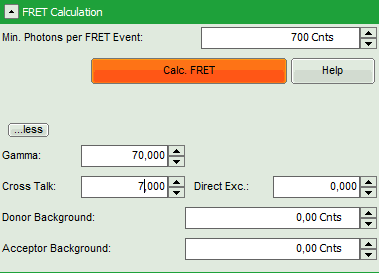
- Set the Min. Photons per FRET event to “700” Cnts (counts).
- Click on “more” to open the additional options for entering the correction parameters.
↓
- As parameters, enter “70” for “Gamma” and “7” for “Cross Talk”.
Note: For more information about the equation used for image calculation, use the help button next to the “Calc. FRET” button. This opens a window with the equations and a description of the fitting parameters.
The correction parameters here are arbitrarily set to result in an image where the FRET efficiency matches roughly the values obtained in the “Lifetime FRET Image” script (see the corresponding tutorial). They have not been correctly determined and are only used for demonstrating the function of the script.
- Click “Calculate FRET”.
Response:
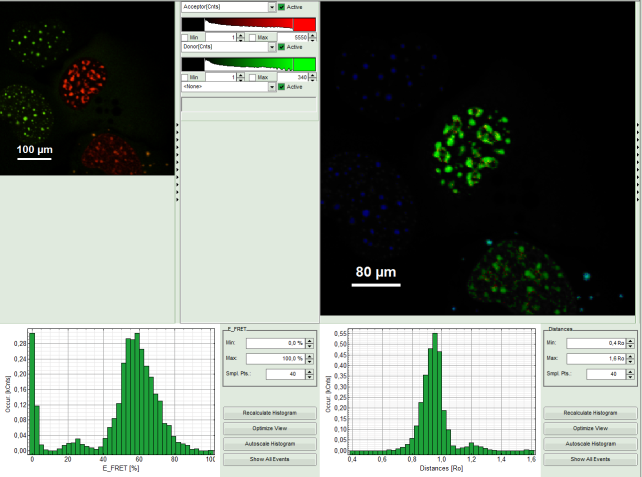
- The FRET image is calculated, and the corresponding histograms are calculated. In the FRET image the FRET efficiency is only calculated for pixels with intensities higher than the threshold.
- The FRET efficiency color scale is automatically set from 0 to 100% FRET efficiency.
- The FRET efficiency histogram and the Distances histogram are shown.
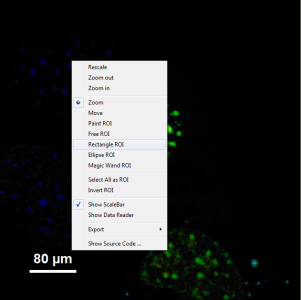
- It can be seen that a few fluorescent dots on the lower right are over the set intensity threshold. As these signals are not in an area of interest, place the mouse cursor over the FRET image, activate the context menu with a right mouse click and select the “Rectangle ROI” tool.
- Now it is possible to remove the unwanted area by constantly pressing the “CRTL” button and the left mouse button, draw a rectangle over these areas and release mouse and keyboard. Do this repetitively until all unwanted signals are removed.
- Press “Calculate FRET” again to update the histograms.
Response: The FRET efficiency and distance histograms are updated. This can be seen clearly at the small peak around 20% FRET efficiency which disappears now.
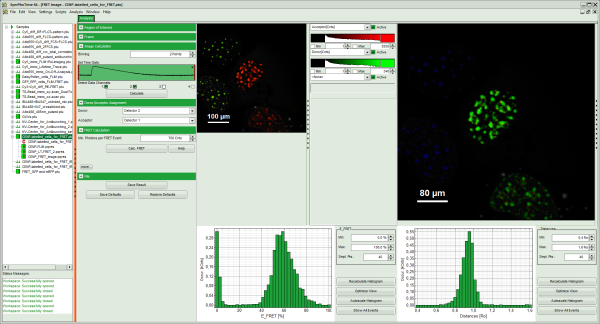
- Store the result by clicking on “Save Result.
Response: A result file is generated and linked to the raw data file.
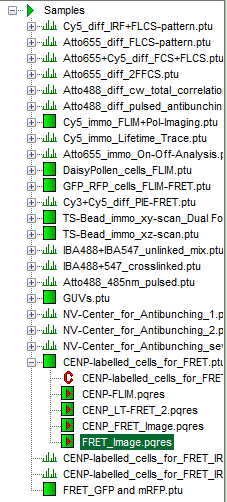
- The image analysis is now finished. There are several possibilities to continue:
- To adapt the histogram plots, change the plot parameters on the right of the histogram to the desired values and click “Recalculate”. To save these plots, click “Save Results” again.
- To export certain analyses, place the mouse cursor over the area of interest, activate the context menu with a right mouse click and choose the export function of interest to export the data.
- In case one wants to analyze many images with the same FRET pair, it is possible to save the starting values for the fits by clicking on “Save Defaults” and store the starting values as a User Profile by entering the main menu (“Settings\Save User Profile as”). The software will need to restart to adapt the changes.
- If you don't want to do anything more, just close the result window.
