Intensity Time Trace Analysis
Summary
This tutorial shows step-by-step, how to draw intensity time traces from a single molecule. The script requires a point measurement of an immobilized fluorophore. When applied to images, it can be used to check for line and frame marker presence and assignment.
Step-by-Step Tutorial
Select a file and start the script
- Start SymPhoTime 64 software.
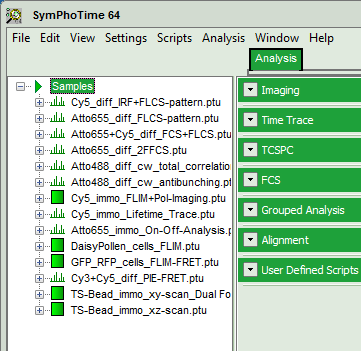
- Open the “Samples” workspace via “File\open Workspace” from the main menu.
Note: The “Samples” workspace is delivered with the SymPhoTime 64 and on the CD-ROM and contains example data to show the function of the SymPhoTime data analysis. If you haven't installed it on your computer, copy it from the DVD onto a local drive before going through this tutorial, e.g. to a folder C:\SPT_User.
Response: The files of the sample workspace are displayed in the workspace panel on the left side of the main window.
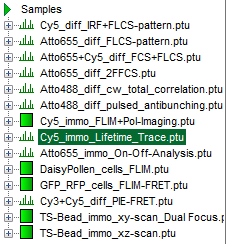
- Highlight the file
Cy5_immo_Lifetime_Trace.ptuby a single mouse click.
Note: This file contains a fluorescence time trace of an immobilized Cy5 molecule, its fluorescence was split by polarization onto two detectors.
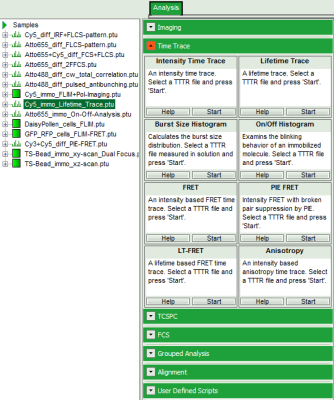
- Select the “Analysis” tab and in there, open the drop down menu “TimeTrace”.
Note: The drop down menu can be opened and closed by clicking on the grey button on the left side of the header of the drop down menu: 
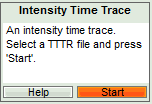
- Start the “Intensity TimeTrace” script by clicking on “Start”.
Response: The “Intensity Time Trace” script is applied to the file Cy5_immo_Lifetime_Trace.ptu. Thereby, a new Window opens:
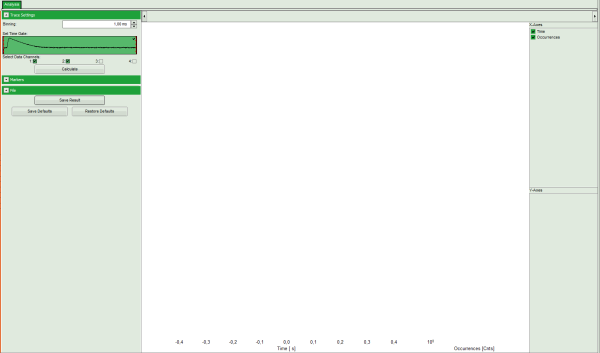
Note: The window contains two different regions:
- Left: Plotting options.
- Center/right: Intensity time trace. As no time traces have been calculated yet, this area is still empty.
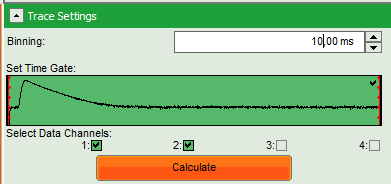
- Select a “Binning” of 10 ms.
- Click “Calculate”.
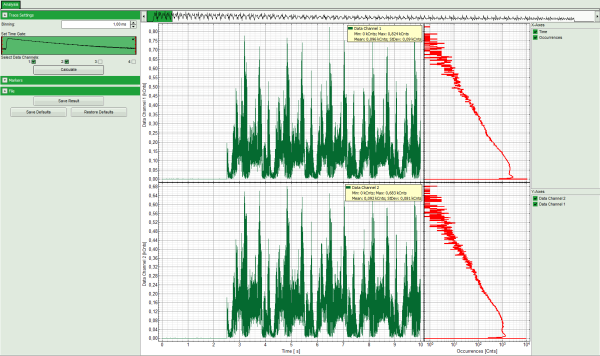
Response: As activated under “Select data channels”, two intensity plots are calculated and plotted according to the two selected detector channels.
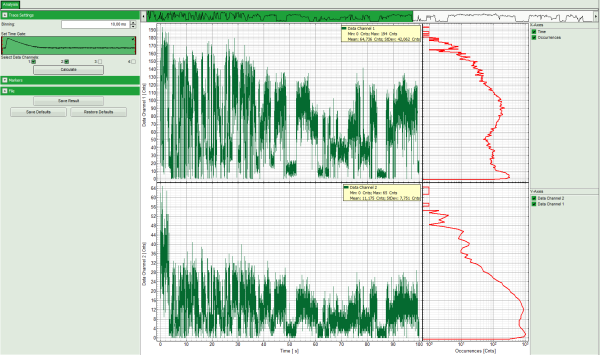
Note: The plot consists of several parts:
In the small upper panel, the complete time trace is plotted as the sum of all intensity channels.
The main intensity time trace plots show the subsection of the trace marked in green in the upper trace for the two channels.
On the right, photon counting histograms (PCH) are plotted, indicating the frequency of different intensity values.
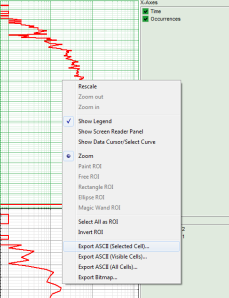
- To export data, e.g. the upper PCH histogram, place the mouse cursor in that region and open the context menu with a right mouse click. Select “Export ASCII: Selected cell”.
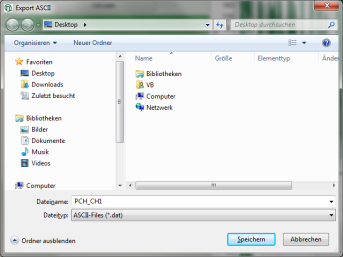
Response: A window opens asking for a file name to store the data.
- Save the data. They can be opened e.g. with the “Notepad” program and imported into a suited fitting software.
- Save the generated time traces by clicking “Save Result”.
Response: A result file TimeTrace.pqres is generated.
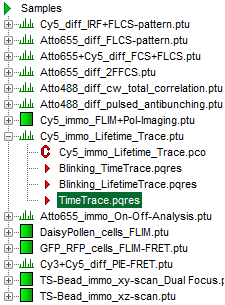
- The intensity time trace window can now be closed.
Checking Marker Signals in Images
Note: PicoQuant photon counting boards can register up to four external marker signals. These marker signals are usually generated by a scanning device. Usually, in a FLIM&FCS upgrade kit for Laser Scanning Microscopes (LSM), three markers are used: “line start”, “line stop” and “frame marker”.
These markers can be visualized using the “Intensity Time Trace” script to assign them correctly during the configuration of new setups.
- In the sample workspace, select the file
GUVs.ptuand apply the time trace script to that file. When the intensity time trace window opens, click “Calculate” using a binning of 1 ms as set by default.
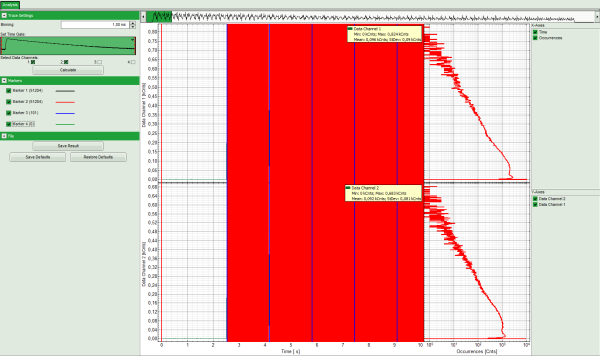
Note: When the intensity time trace of an image is displayed, the scanning results in intensity spikes.
- Open the pulldown menu “Marker” and select all markers.
Response: The marker signals are drawn in the time trace. It can already be seen that the blue marker is more sparse. The marker pull down window also shows, now many markers are present.
Note: The image contains three different markers. Marker 1 and 2 are the most frequent markers, i.e. they serve as line start and line stop signals, whereas marker 3 is less frequent and serves as frame marker. In the image below, the frame markers can be clearly distinguished, while the line markers are too closely spaced for discrimination.
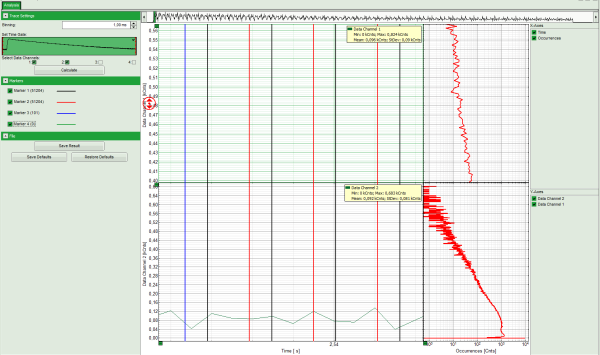
- Zoom into the time trace image to distinguish between the individual line markers. This is done by moving the mouse cursor into the region to be zoomed in, pressing the left mouse button and keeping it pressed while moving to the cursor to the end of the region to be zoomed in and releasing the mouse button. This has to be done several times until a sufficient magnification as in the image below is achieved.
Note: It can be clearly seen that the distance between the black marker 1 and the next red marker 2 to the right is bigger than the distance between the red marker 2 and the following black marker 1 on the right. As this was a mono-directionally scanned image, the return from the end of the line to the line start position is done with highest possible speed. In contrast, the scanning of the actual line is performed according to the user settings, which are usually slower, but never faster than the backfly of the scanner. Therefore, in this measurement, marker 1 and 2 are the line start and line stop markers, respectively.
- You can zoom out again by activating the context menu with a right mouse click and select “Rescale”.
- In this way, the marker assignment for this file has been checked and the window can be closed. As we are not interested in the data itself, there is no need to store this file.
