Determination of the Focal Width
Summary
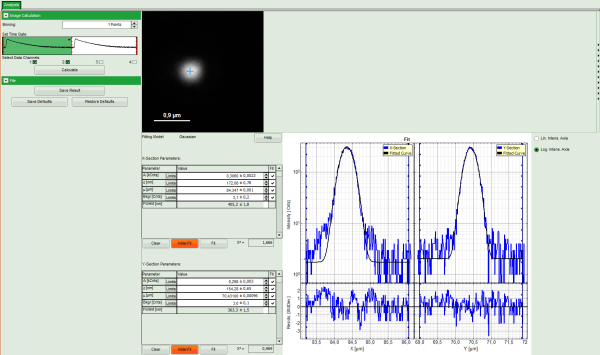
This tutorial shows step-by-step, how to determine the Point Spread Function (PSF) of a microscopic system using the Focal Width Script. It requires the image of a subresolution bead, in which the center is marked in the image. The script applies then a Gaussian fit of the bead and calculates the Full Width Half Maximum (FWHM) in both scanning directions.
Step-by-Step Tutorial
Select a file and start the script
- Start SymPhoTime 64 software.
- Open the “Samples” workspace via “File\open Workspace” from the main menu.
Note: The “Samples” workspace is delivered with the SymPhoTime 64 and on the DVD-ROM and contains example data to show the function of the SymPhoTime 64 data analysis. If you haven't installed it on your computer, copy it from the DVD onto a local drive before going through this tutorial, e.g. to a folder “C:\SPT_User”.
Response: The files of the sample workspace are displayed in the workspace panel on the left side of the main window.
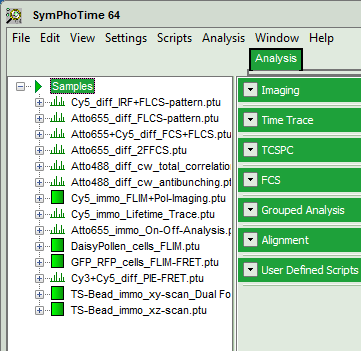
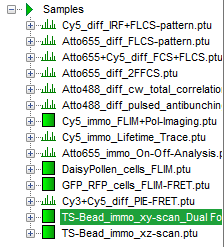
- Highlight the file
TS-Bead_immo_xy-scan.ptuby a single mouse click.
Note: This file contains the image of a TetraSpeck Bead with 100 nm diameter. As this is smaller than the optical resolution, beads of this size can be used to measure the focal width in a microscope system.
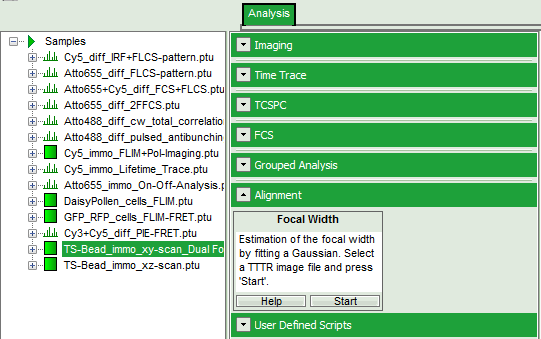
- Select the “Analysis” tab and in there, open the drop down menu “Alignment”.
Note: The drop down menu can be opened and closed by clicking on the grey button on the left side of the header of the drop down menu: 
- Start the “Focal Width” script by clicking on “Start”.
Response: The “Focal Width” script is applied to the file TS-Bead_immo_xy-scan_DualFocus.ptu. Thereby, a new Window opens:
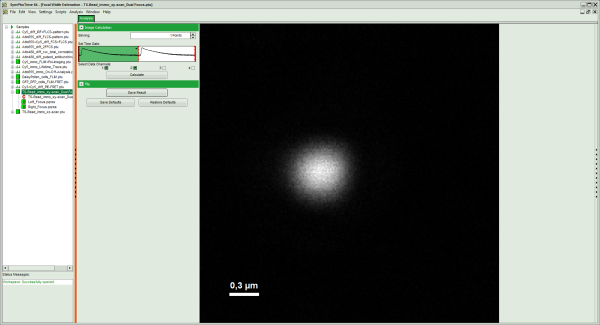
Note: The window contains two different regions:
- Left: Image plotting analysis options.
- Center/right: Image, plotted in an intensity grey scale. To adjust brightness and contrast, click on the vertically aligned arrows on the right.
Optional: The following parameters can be adapted:
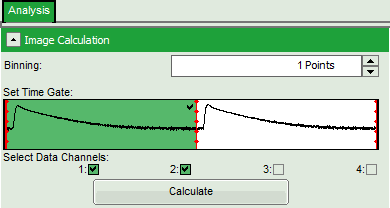
- Pixel binning by changing the “Binning”, e.g. to twopoints.
- Select the second excitation peak by clicking on the white area of the “Set Time Gate” graph.
Note: The data in the file is a bead that was excited via pulsed interleaved excitation (PIE) using two perpendicularly polarized lasers, which were guided through a DIC prism. This causes a displacement of the beams, which is used in dual focus FCS (2fFCS) measurements.
If data are acquired with a scanner controlled by the SymPhoTime 64 software (i.e. the piezo scanner in the MicroTime200), the image dimensions are automatically correct. If the image is acquired using an external scanner, the image size has to be defined or transferred before the measurement to make sure that the measured image dimensions are correct. Otherwise, one pixel is considered to a size of 1 µm.
- When finished, click “Calculate” to update the image.
- Click into the intensity center of the bead.
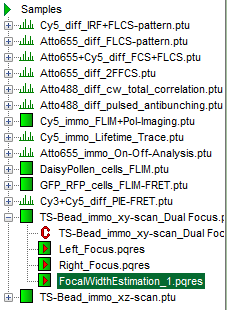
- The image fitting is already done and you can click on “Save Result” to store the data. This generates an analysis results (
.pqres)-file, which is assigned to the corresponding raw data (.ptu) file.
- Optional: Apply the same script to the file
TS-bead_immo_xz-scan.ptuto get an idea about the ratio of the focal width in xy vs. z.
